What is Calibration
Target Accuracy?

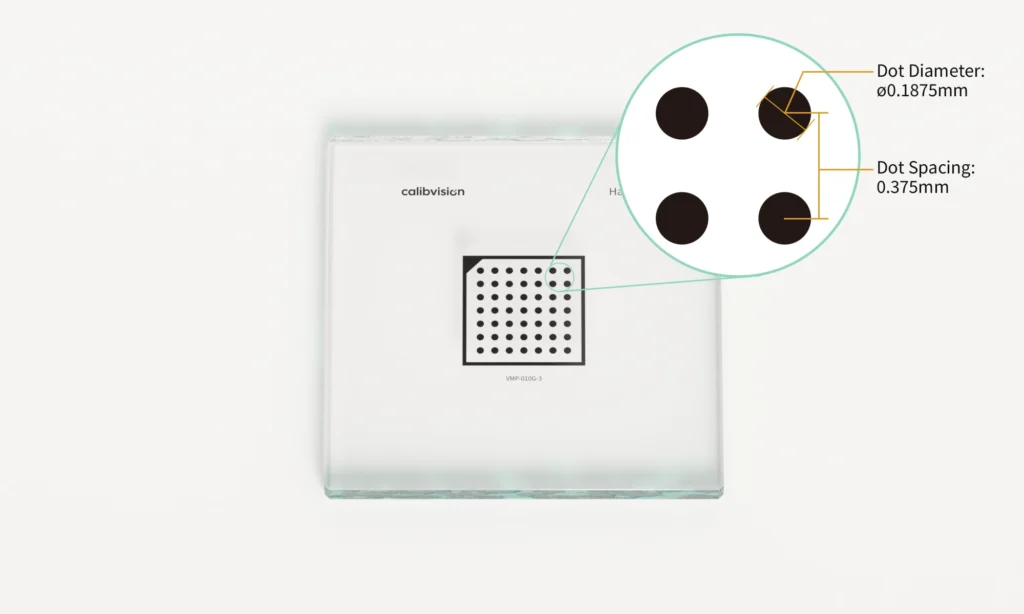
When we talk about calibration target accuracy, we’re really asking one basic question: “How perfect is this pattern?” Just like when you buy a ruler, you want to make sure the measurements are correct. A calibration target works the same way – it needs to be extremely precise for your camera to work properly.
What is Feature Position Accuracy?
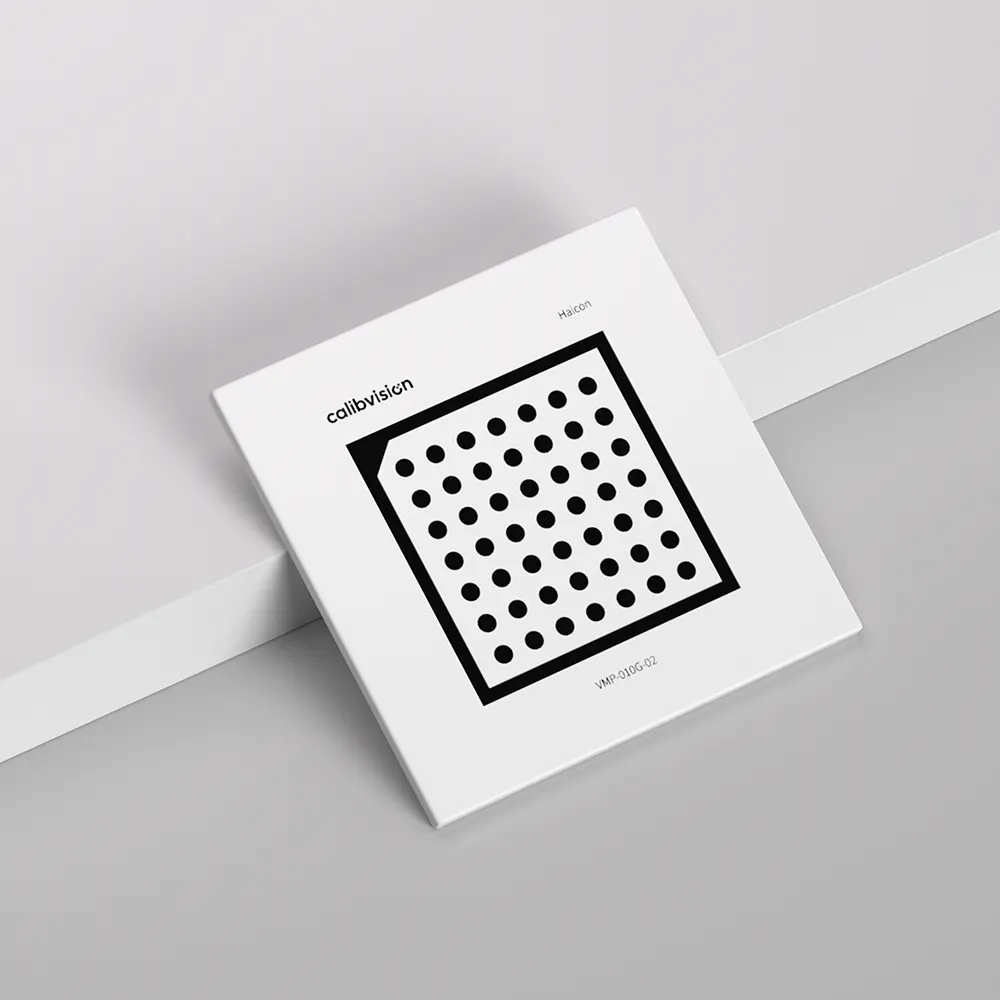
There are two main ways we check if a calibration target is accurate enough. The first is called feature position accuracy, which is basically asking “Are all the dots or squares in exactly the right spots?” Think of it like this: imagine you drew a perfect grid on a piece of paper with a computer, then tried to print it out. Position accuracy tells you how close your printed version is to that perfect computer drawing. If some dots ended up a little too far left or right, or up or down, that would show up as poor position accuracy.
What is Feature Spacing Accuracy?
The second type is feature spacing accuracy, which asks a different question: “Are all the gaps between neighboring dots exactly the same size?” Picture a fence with evenly spaced posts. Even if each post is in roughly the right area, you’d still want the distance between post 1 and post 2 to be exactly the same as the distance between post 2 and post 3. That’s what spacing accuracy measures – the consistency of those gaps between features.
Why Calibration Target Accuracy Matters?
Both types of accuracy matter because they affect different things. If the overall positions are wrong, your entire measurement system will be shifted or twisted. If the spacing between features isn’t consistent, your measurements might be correct in some areas but wrong in others. It’s like having a ruler where the first few inches are accurate, but then the spacing gets gradually more compressed toward the end.
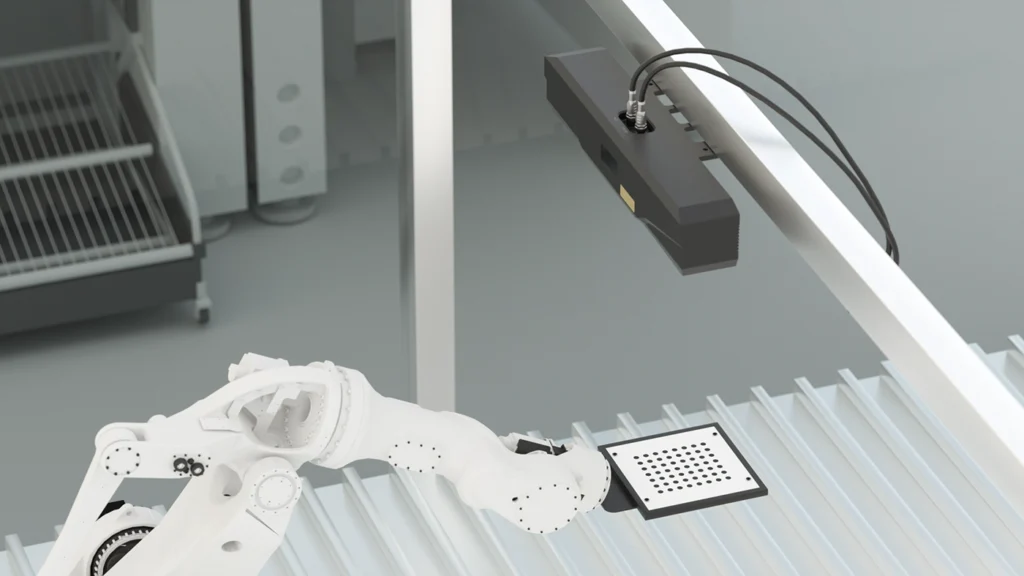
For anyone using machine vision or camera calibration systems, understanding these two accuracy types helps explain why some calibration targets cost more than others. A cheap target might look fine to your eyes, but when a computer tries to use it for precise measurements, those tiny position and spacing errors add up quickly. That’s why professional applications require targets with accuracy measured in microns – because even the smallest imperfections can throw off an entire measurement system.
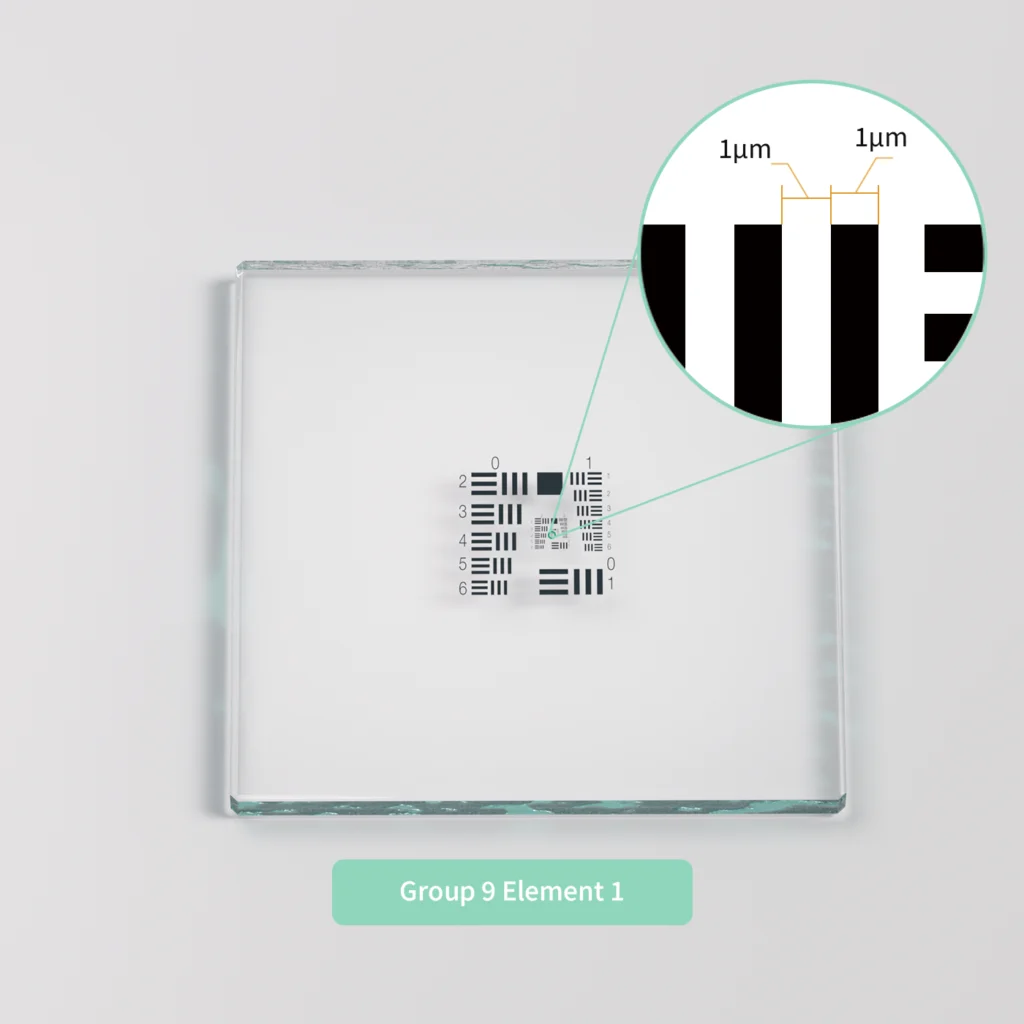

Feature Size Accuracy

Minimum Feature Size

Feature Spacing Accuracy

Feature Position Accuracy
How to Measure Calibration Target Accuracy?
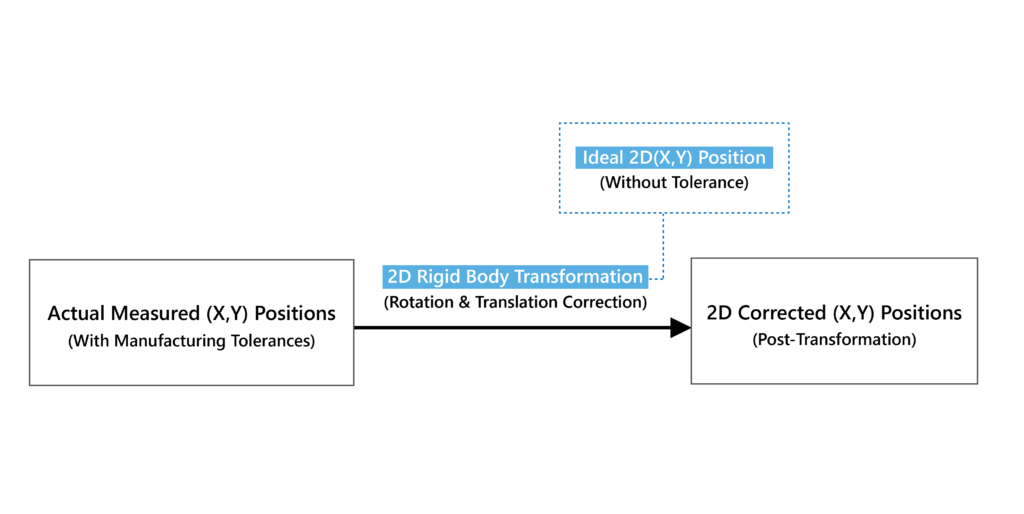
For most measurement results, the measured (x, y) positions may generally have an inclination or eccentricity effect regarding its ideal positions. The original (x, y) results are transformed by a best-fit 2D rigid transformation, which will not change relative position of all points, towards their ideal (x, y) value. After this transformation, the inclination and eccentricity effect of measured value can be eliminated.
| Actual Measured (X, Y) positions | ||
|---|---|---|
| Point Index | Actual X/mm | Actual Y/mm |
| 1 | -0.00069 | 0.00028 |
| 2 | 14.99929 | 0.00006 |
| 3 | 30.00429 | 0.00048 |
| 4 | 0.00106 | 14.99828 |
| 5 | 15.00132 | 14.99835 |
| 6 | 30.00636 | 14.99805 |
| 7 | 0.00280 | 29.99889 |
| 8 | 15.00330 | 29.99928 |
| 9 | 30.00874 | 29.99897 |
| Ideal 2D (X, Y) Position | ||
|---|---|---|
| Point Index | Target X/mm | Target Y/mm |
| 1 | 0 | 0 |
| 2 | 15 | 0 |
| 3 | 30 | 0 |
| 4 | 0 | 15 |
| 5 | 15 | 15 |
| 6 | 30 | 15 |
| 7 | 0 | 30 |
| 8 | 15 | 30 |
| 9 | 30 | 30 |
| 2D Affined (X, Y) Positions | ||
|---|---|---|
| Point Index | 2D Rigid Transformed X/mm | 2D Rigid Transformed Y/mm |
| 1 | -0.00264 | 0.00011 |
| 2 | 14.99734 | 0.00088 |
| 3 | 30.00234 | 0.00229 |
| 4 | -0.00188 | 14.99811 |
| 5 | 14.99838 | 14.99917 |
| 6 | 30.00342 | 14.99986 |
| 7 | -0.00113 | 29.99872 |
| 8 | 14.99937 | 30.00010 |
| 9 | 30.00481 | 30.00078 |
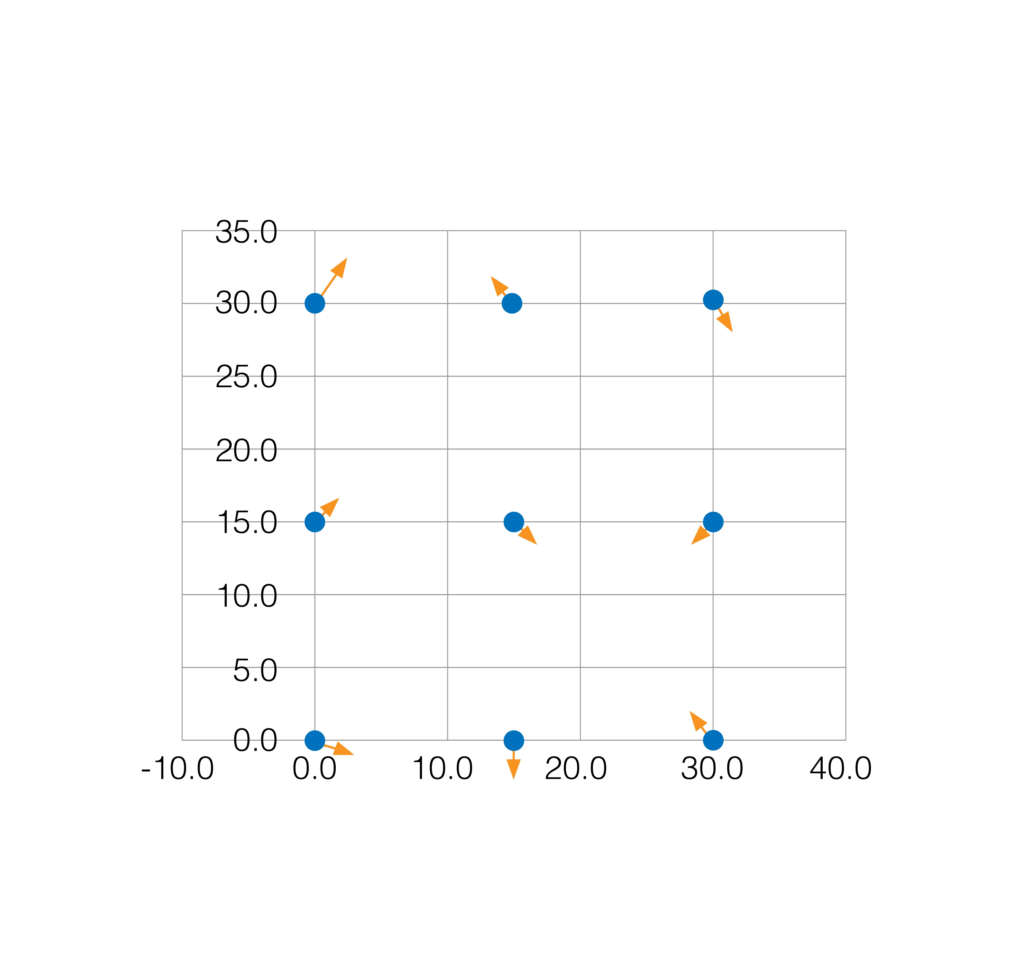
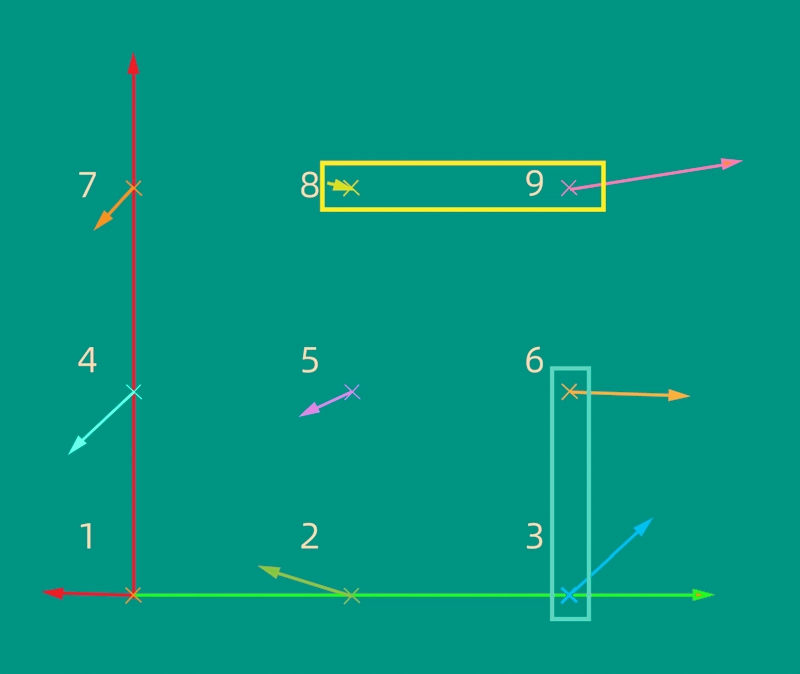
Feature Position Accuracy among Entire Pattern Area

| Feature Position Accuracy among Entire Pattern Area | |||
|---|---|---|---|
| Point Index | Tolerances X/mm | Tolerances Y/mm | Distance vector of a point to its ideal (x, y) location |
| 1 | -0.00264 | 0.00011 | 0.00264 |
| 2 | -0.00266 | 0.00088 | 0.00280 |
| 3 | 0.00234 | 0.00229 | 0.00327 |
| 4 | -0.00188 | -0.00189 | 0.00267 |
| 5 | -0.00162 | -0.00083 | 0.00182 |
| 6 | 0.00342 | -0.00014 | 0.00342 |
| 7 | -0.00113 | -0.00128 | 0.00171 |
| 8 | -0.00063 | 0.00010 | 0.00064 |
| 9 | 0.00481 | 0.00078 | 0.00487 |
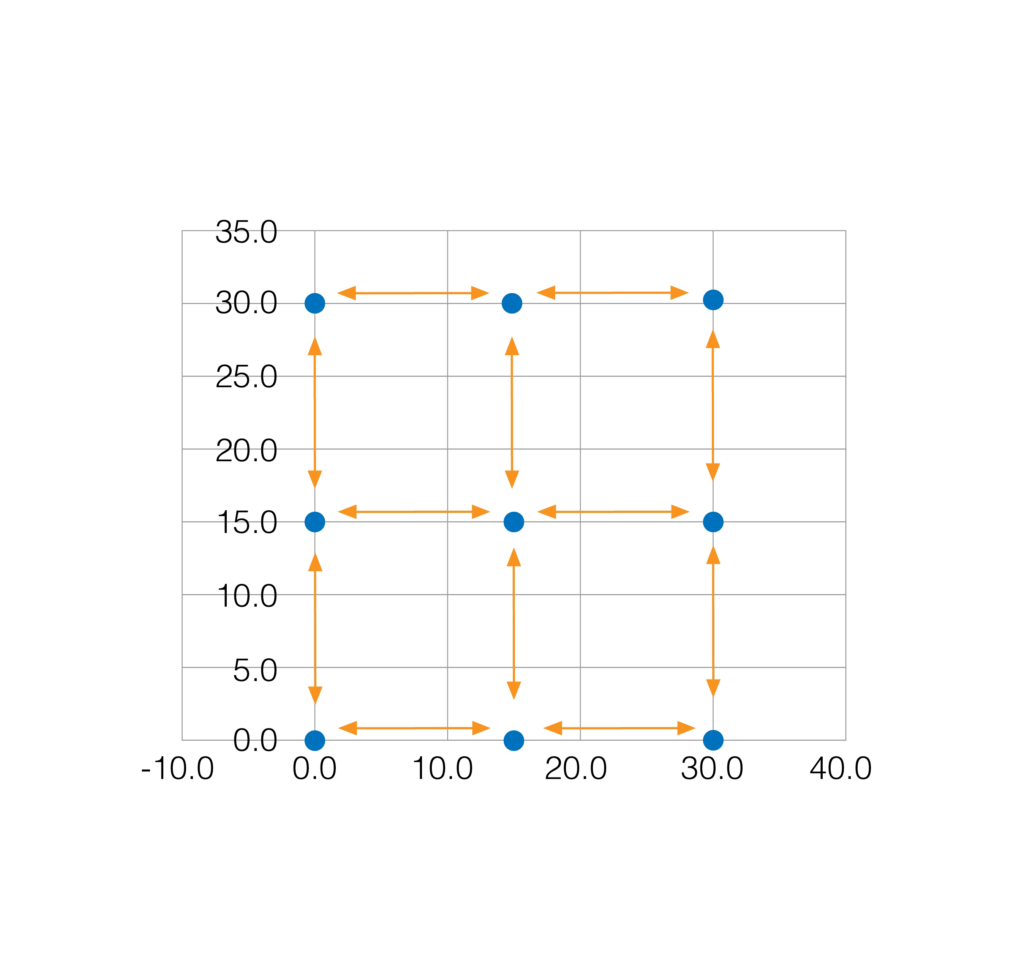
Feature Spacing Accuracy of Any 2 Neighbor Points
|
Feature Spacing Accuracy of Any 2 Neighbor Points (For 3 X 3 grid, there are 12 nearest-neighbor distances) |
||||
|---|---|---|---|---|
| Distance Index | Distance | Actual 2-Point Distance Values | Ideal 2-Point Distance Values | Tolerance (Actual - Ideal) |
| 1 | Distance(1,2) | 14.99998 | 15.00000 | 0.0000 |
| 2 | Distance(1,4) | 14.99800 | 15.00000 | -0.0020 |
| 3 | Distance(2,3) | 15.00500 | 15.00000 | 0.0050 |
| 4 | Distance(2,5) | 14.99829 | 15.00000 | -0.0017 |
| 5 | Distance(3,6) | 14.99757 | 15.00000 | -0.0024 |
| 6 | Distance(4,5) | 15.00026 | 15.00000 | 0.0003 |
| 7 | Distance(4,7) | 15.00061 | 15.00000 | 0.0006 |
| 8 | Distance(5,6) | 15.00504 | 15.00000 | 0.0050 |
| 9 | Distance(5,8) | 15.00093 | 15.00000 | 0.0009 |
| 10 | Distance(6,9) | 15.00092 | 15.00000 | 0.0009 |
| 11 | Distance(7,8) | 15.00050 | 15.00000 | 0.0005 |
| 12 | Distance(8,9) | 15.00544 | 15.00000 | 0.0054 |