Shine a flashlight at a mirror and the beam bounces off at one precise angle — step out of that angle and you see nothing. Shine it at a white wall and the wall lights up the whole room, the same from wherever you stand. That difference between specular and diffuse reflection is what makes diffuse reflectance standards possible, and the property that makes a good one reliable has a name: Lambertian reflectance.
A Lambertian surface reflects light so that its apparent brightness is the same from every viewing angle. That is precisely what a sensor needs from a calibration target — a reflectance value it can trust regardless of geometry. This article covers the physics of Lambertian surfaces, Lambert’s cosine law, the BRDF that describes reflection fully, the ways real surfaces deviate, and how to verify a target is genuinely Lambertian before you rely on it. For the full application picture, see the guide to diffuse reflectance standards for LiDAR.
The two types of reflection
All reflection sits on a spectrum between two extremes. Specular reflection obeys the law of reflection — angle in equals angle out — and looks shiny: polished metal, glass, calm water. For calibration it is disastrous, because a sensor a few degrees off the specular angle receives almost no return. Diffuse reflection scatters light in all directions and looks matte: unglazed ceramic, matte paint, fresh snow. Its brightness is nearly constant across viewing angles, which is exactly what makes it usable.
Real surfaces mix the two:
| Surface | Diffuse | Specular | Character |
|---|---|---|---|
| Perfect mirror | 0% | 100% | Pure specular |
| Glossy paint | 60% | 40% | Mixed — problematic |
| Satin finish | 85% | 15% | Mostly diffuse |
| Matte ceramic | 98% | 2% | Near-ideal diffuse |
| Perfect Lambertian | 100% | 0% | Ideal (theoretical) |
For a calibration target you want more than 95% diffuse and under 5% specular, across the wavelengths your sensor uses — not just the visible band.
What is Lambertian reflectance?
A surface is Lambertian if its radiance — brightness per unit projected area — is constant in every direction. Put plainly: no matter where you put your eye or your sensor, the surface looks equally bright.
This comes from geometry, not from the surface “knowing” your angle. View a glowing tile head-on and you see its full area. Tilt to 60° and it looks foreshortened to half the area — but for a Lambertian surface the intensity per unit solid angle also falls by cos(60°), and the two effects cancel. The result is constant apparent brightness at every angle, described by a single number: its reflectance.
One distinction trips people up: Lambertian is not isotropic. An isotropic emitter radiates equal intensity in all directions; a Lambertian surface radiates intensity that falls as cos(θ). What stays constant is radiance (brightness per apparent area), not intensity. A supplier who calls a target “isotropic” is either mistaken or means Lambertian.
Not every diffuse model is Lambertian, either. The Oren-Nayar model adds surface-roughness effects and reduces to Lambertian only for smooth matte surfaces; the Phong model mixes in a specular term and is a graphics tool, not a calibration surface. For a reflectance standard, you want pure Lambertian with a negligible specular component.
Lambert’s cosine law
For a Lambertian surface, the reflected intensity in a direction θ from the surface normal is:
I(θ) = I₀ × cos(θ)
where I₀ is the intensity along the normal. So at 30° you get 86.6% of I₀, at 45° 70.7%, at 60° 50%, and at grazing angles it falls toward zero. The law follows from energy conservation and the projected-area geometry above — it is not an empirical fudge.
Worked example: LiDAR calibration
Testing a 905 nm automotive LiDAR against a 50% Lambertian standard, you expect the return to track cos(θ). A good target does; a poor one drifts badly with angle:
| Target angle | cos(θ) — expected | Good target | Poor target |
|---|---|---|---|
| 0° | 100% | 99.8% | 98% |
| 15° | 96.6% | 96.2% | 102% ⚠ |
| 30° | 86.6% | 86.1% | 79% ⚠ |
| 45° | 70.7% | 70.2% | 58% ✗ |
| 60° | 50.0% | 49.7% | 31% ✗ |
The consequence is real: calibrate on the poor target at 0° (where it happens to be close) and use the sensor at 45° (where it reads 18 points low), and the sensor now misreads reflectance — potentially classifying a low-reflectance pedestrian as something else. The target has quietly invalidated the calibration.
Why surfaces become Lambertian
Lambertian behaviour always comes from the same thing: light being scattered enough times that it loses all memory of the direction it came in. Three mechanisms achieve it:
- Surface roughness — microscopic facets (much smaller than the wavelength) reflect in every direction. Simple and durable, but only 85–90% conformity and wavelength-dependent.
- Volume scattering — light penetrates a translucent material and scatters many times before re-emerging. This is the gold standard: sintered PTFE and barium sulfate reach 98–99% conformity across a wide spectrum, at the cost of fragility.
- Engineered coatings — a designed coating combining controlled roughness and internal scatterers, trading a little conformity for durability, patternability and tailored spectral response.
| Mechanism | Conformity | Spectral range | Durability |
|---|---|---|---|
| Surface roughness | 85–90% | Limited | Good |
| Volume scattering (PTFE, BaSO₄) | 98–99% | Excellent | Poor |
| Engineered coating | 95–97% | Excellent | Excellent |
You cannot make a Lambertian surface with a single reflection — it takes many scattering events, either through a volume or across many facets. Scattering efficiency also depends on particle size versus wavelength, which is why a target that is beautifully Lambertian at 500 nm can misbehave at 1550 nm, and why broadband targets use a distribution of scatterer sizes.
BRDF: the complete description
The full description of how a surface reflects is the Bidirectional Reflectance Distribution Function (BRDF) — how much light reflects toward a given direction for light arriving from another. For an ideal Lambertian surface it collapses to a single constant:
BRDF = ρ / π (ρ = reflectance)
It does not depend on incident or viewing angle at all — one number describes the surface. Real targets deviate slightly, and the size of that deviation is the Lambertian conformity figure:
| Conformity | Max BRDF deviation | Grade |
|---|---|---|
| 99% | <1% | Exceptional |
| 95% | <5% | Professional |
| 90% | <10% | Good |
| 80% | <20% | Fair — avoid for calibration |
Measuring a full BRDF needs a goniometric spectrometer with precision rotation stages and a stable source — the reason accredited third-party laboratories (accredited to ISO 17025) are the ones that produce BRDF calibration data, and why it belongs on a certificate rather than being something you measure in-house.
How real surfaces deviate from ideal
No surface is perfectly Lambertian. The deviations worth knowing about:
- Retro-reflection — extra return straight back toward the source (corner-cube microstructures, some powders). Makes 0° readings artificially high.
- Forward-scatter preference — thin or translucent coatings scatter more forward than back, so a backscatter LiDAR sees them dimmer than expected. Fixed by adequate coating thickness and volume scattering.
- Grazing-angle shadowing — beyond ~60°, surface texture shadows itself and the return drops faster than cos(θ). Usually acceptable, since sensors rarely work past 70°; good targets specify conformity “for θ ≤ 60°”.
- Wavelength dependence — a target tuned for visible light can be poor at 1550 nm. Verify at your wavelength.
- Polarization dependence — real surfaces can retain some incident polarization at large angles; quality targets specify a high depolarization ratio.
- Temperature — thermal expansion shifts the microstructure a little; outdoor targets that reach 60 °C in sun behave slightly differently than at 20 °C. Low-temperature-coefficient targets and thermal stabilisation handle it.
Why Lambertian properties matter for calibration
Lambertian behaviour lets you separate the target’s reflectance from the geometry of the measurement — and that separation is what makes a calibration transferable.
- Angle-independent measurement. A roof LiDAR hits a target at many angles as it scans. With a Lambertian target the returns follow a simple cosine you can correct for; with a poor one the relationship is unknown and you can only calibrate at one angle.
- Sensor fusion. Camera-LiDAR extrinsic calibration matches the same feature in both sensors. If LiDAR intensity varies unpredictably with angle, the intensity peak stops coinciding with the geometric feature and the fusion picks up centimetres of error — which at speed is a safety problem.
- Repeatability over time. With a Lambertian target a ±5° mounting variation barely moves the reading, so you can track genuine sensor drift across months; with an angle-sensitive target, mounting slop swamps the drift you are trying to detect.
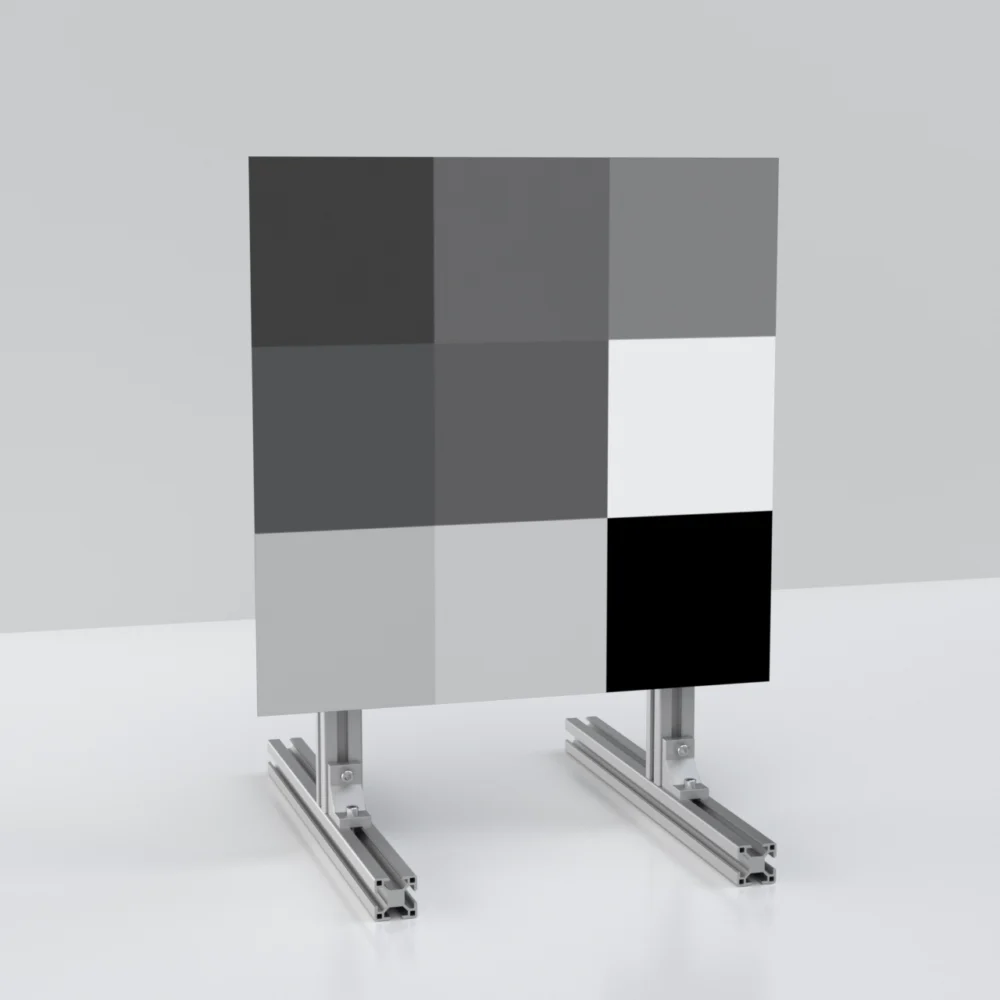
The same matte, diffuse behaviour is why the grey fields on image-quality charts must be Lambertian too — see the ISO 15739 noise chart and the 18% grey background on the ISO 16505 SFR chart.
Surfaces to avoid
Common substitutes that look diffuse but fail as standards:
- Photography grey cards — uncalibrated (±10% unit to unit), slightly glossy, visible-only; at 905 nm the reflectance is not what the label says.
- White paper — fluorescent brighteners alter the spectrum, texture shadows at angle, and it yellows and degrades.
- Painted surfaces — batch-to-batch variation, uncertain reflectance, environmental drift.
- Retroreflective material — deliberately non-Lambertian; the opposite of what you want (except when specifically testing sign detection).
- Glossy or polished surfaces — dominant specular peak; move 5° and the return collapses.
- Fabric — anisotropic weave, wrinkles, moisture-dependent; not repeatable.
How to verify Lambertian performance
Whether checking a new purchase or an incoming batch, a few tests separate a real Lambertian target from a merely matte one. You can run the first three with your own sensor.
- Angle sweep. Measure at 0°, 30°, 45°, 60° and compare the ratios to cos(θ) — you want I(30°)/I(0°) ≈ 0.87, I(45°)/I(0°) ≈ 0.71, I(60°)/I(0°) ≈ 0.50. All within ±5% is professional grade; any ratio off by more than 15% is a fail. (Larger deviation past 60° from shadowing is normal.)
- Azimuthal symmetry. Measure head-on, then rotate the target 90°, 180°, 270° about its normal. A true Lambertian surface reads the same each time; more than ~5% variation means a directional (grained) surface.
- Uniformity. Measure five spots across the surface; more than ±2–5% spread means a non-uniform coating or contamination.
- Compare to a reference. Run the angle sweep on a known-good standard and on the target; the angular shape should match even if the absolute level differs.
- Read the certificate. A credible one states the Lambertian conformity percentage, the angular range tested (e.g. 0–75° in 15° steps) and the measured-versus-ideal curve. A “diffuse surface” claim with no angular data, or a single 0° measurement, is a red flag — ask the supplier for the angular response.
The bottom line
Lambert’s 260-year-old cosine law is what turns a reflectance target from “some matte surface” into a quantitative reference you can trust across angles, sensors and time. The physics is not complicated — enough scattering to randomise direction gives angle-independent radiance — but achieving it consistently across a wide wavelength range takes the right material, controlled manufacturing and proper characterisation. When you buy a standard, don’t settle for “diffuse”: ask for the Lambertian conformity figure and the angular data behind it.
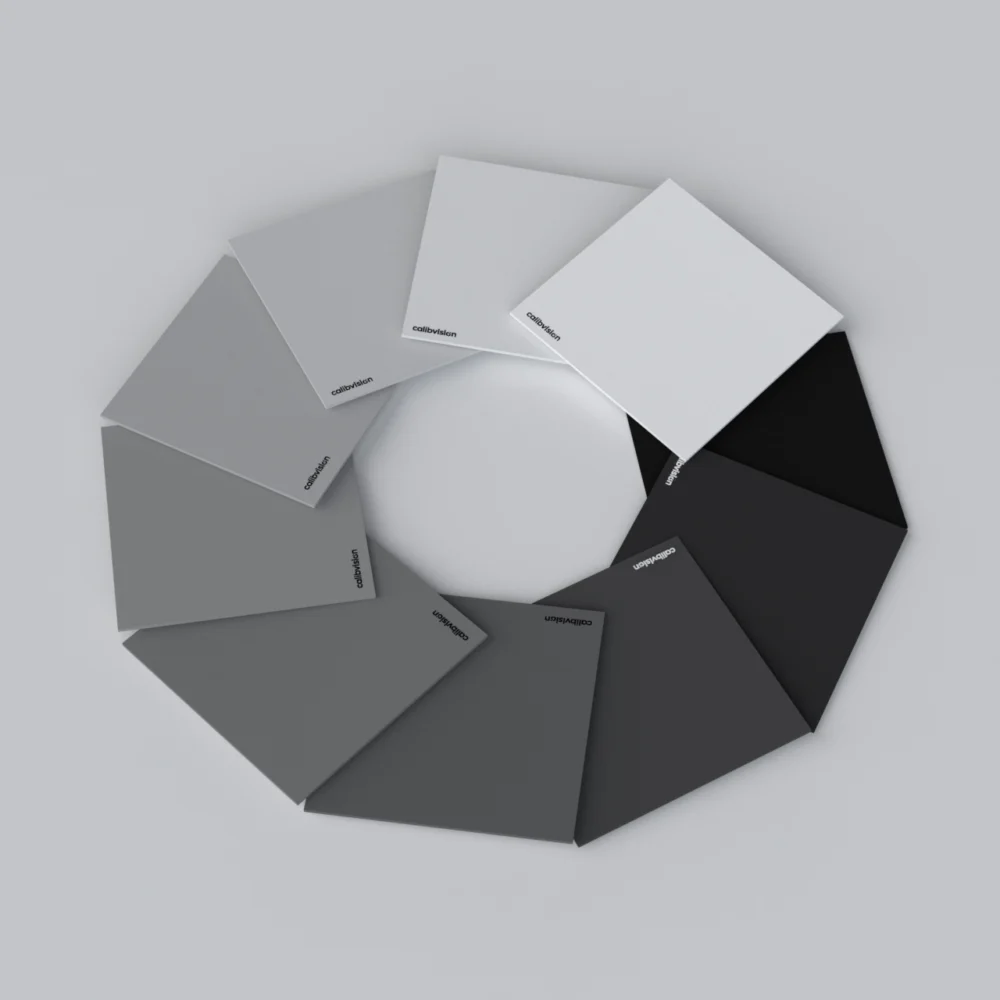
CalibVision’s diffuse reflectance standards are built for this, in three substrate tiers — aluminium plate, honeycomb composite and sintered PTFE — with calibrated reflectance from 1% to 99%, validated at LiDAR wavelengths including 905 nm, and supplied with a serial-numbered report; measurements are NIST/NIM-traceable, with product-level traceability under CNAS L0579 and ILAC-MRA, and third-party CNAS/ILAC calibration on request.