$89.22 – $749.00Price range: $89.22 through $749.00
In-stock standard calibration targets
Quick payment methods options
Ship global instantly
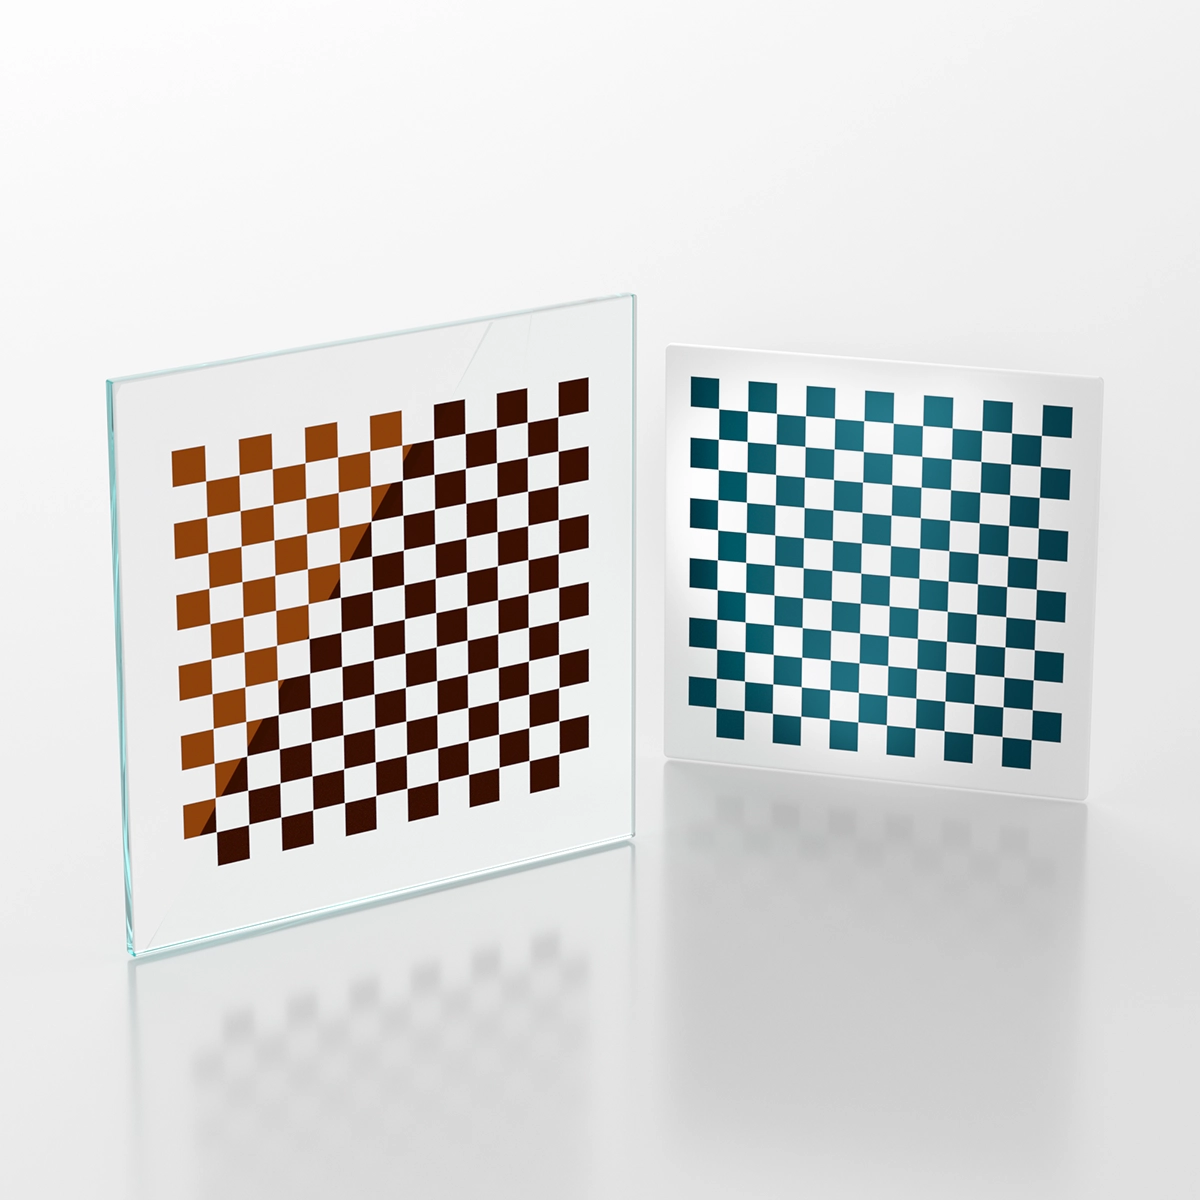
These calibration patterns are made from high-quality soda-lime glass, offering excellent stability and durability for daily use in machine vision and precision measurement environments. They are widely used for calibrating optical systems, XY stages, and various 2D measurement setups.
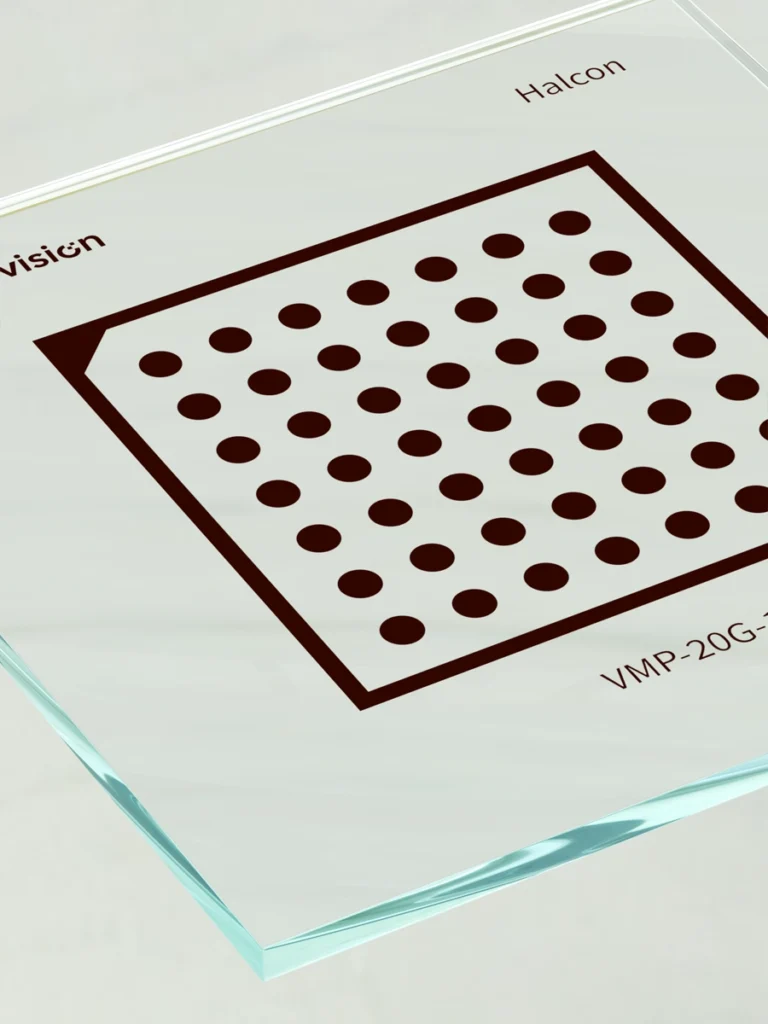
With a feature-to-feature accuracy of up to 1 micron, the targets provide the precision required for system testing, alignment, and performance verification. You can select different dot sizes and spacing options depending on your specific calibration needs.
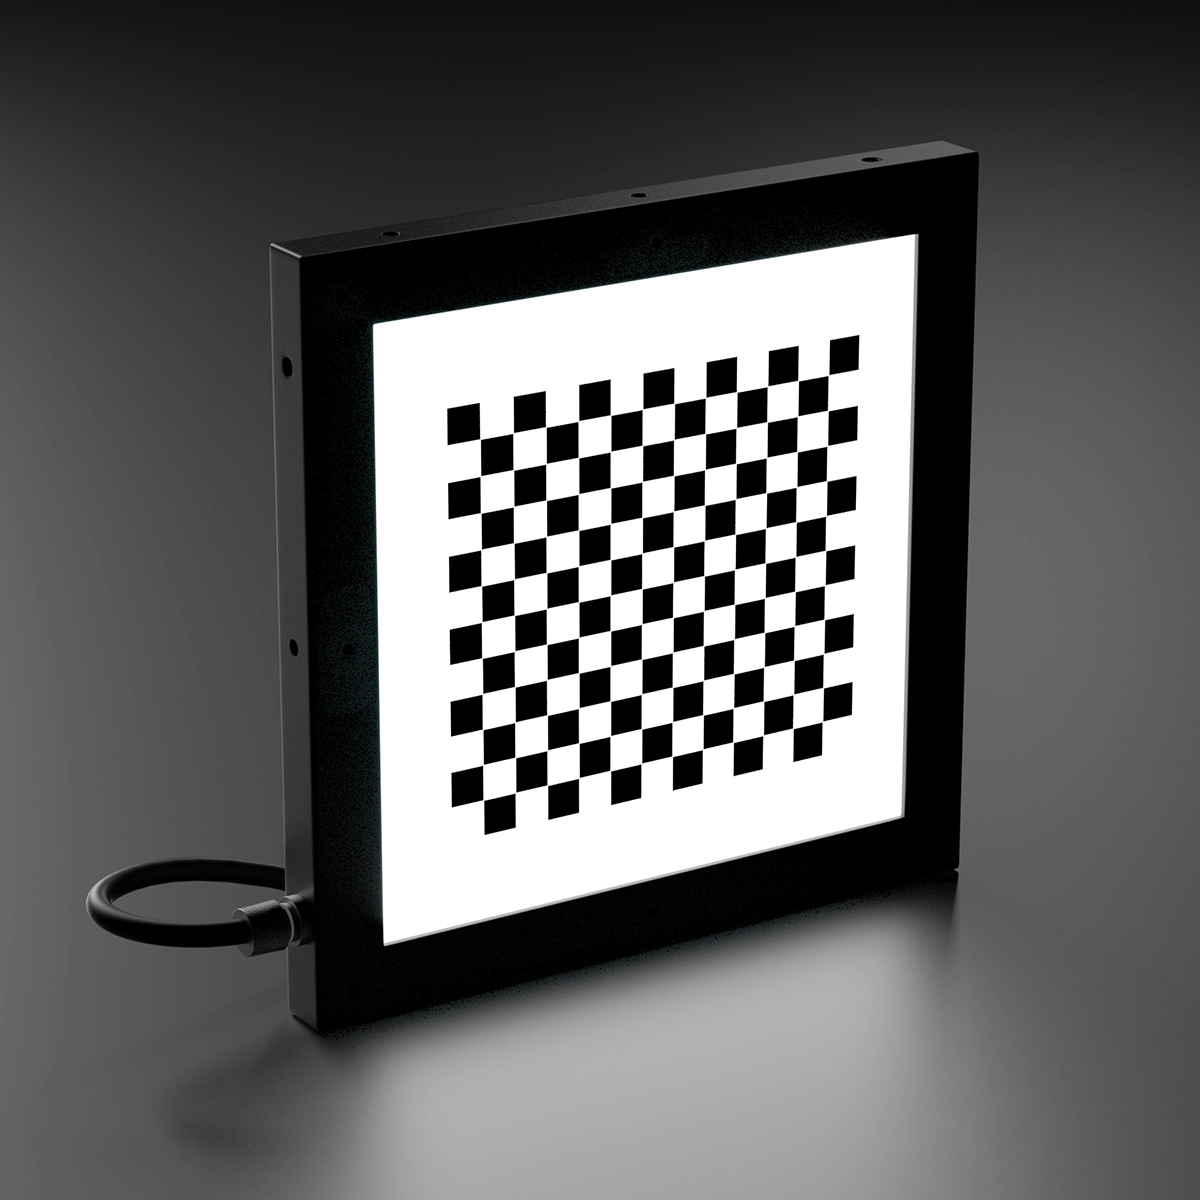
Grid arrays are commonly used to check and correct imaging distortion. In an ideal system, all rows and columns should remain perfectly perpendicular. If the captured image shows bent or curved grids, the distortion pattern can be analyzed and used for system compensation.
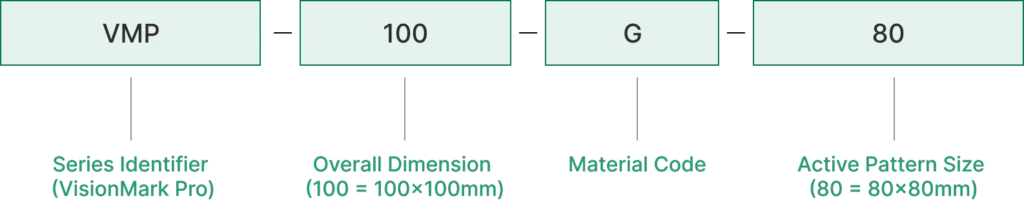
Model Number Breaking Down: VMP-100G-80
Halcon12 Calibration Targets Overview Table
| Model | Substrate Material | Chrome Type | Overall Size (mm) | Active Pattern Size (mm) | Checker Size(mm) | Array | ChessGrid Cornor Position Accuracy |
|---|---|---|---|---|---|---|---|
| VC-15SG-0.5-BC | Soda Lime Glass | Brown Chrome | 15 x 15 | 6 x 4.5 | 0.5 x 0.5 | 9 x 12 | ±1μm |
| VC-15SG-0.75-BC | Soda Lime Glass | Brown Chrome | 15 x 15 | 9 x 0.75 | 0.75 x 0.75 | 9 x 12 | ±1μm |
| VC-15SG-1.0-BC | Soda Lime Glass | Brown Chrome | 15 x 15 | 12 x 9.0 | 1.0 x 1.0 | 9 x 12 | ±1μm |
| VC-25SG-1.5-BC | Soda Lime Glass | Brown Chrome | 25 x 25 | 18 x 13.5 | 1.5 x 1.5 | 9 x 12 | ±1μm |
| VC-30SG-2.0-BC | Soda Lime Glass | Brown Chrome | 30 x 30 | 26 x 24 | 2.0 x 2.0 | 13 x 12 | ±1μm |
| VC-45SG-3.0-BC | Soda Lime Glass | Brown Chrome | 45 x 45 | 39 x 36 | 3.0 x 3.0 | 13 x 12 | ±1μm |
| VC-60SG-4.0-BC | Soda Lime Glass | Brown Chrome | 60 x 60 | 52 x 48 | 4.0 x 4.0 | 13 x 12 | ±1μm |
| VC-88SG-6.0-BC | Soda Lime Glass | Brown Chrome | 88 x 88 | 78 x 78 | 6.0 x 6.0 | 13 x 12 | ±1μm |
| VC-111SG-8.0-BC | Soda Lime Glass | Brown Chrome | 111 x 106 | 106 x 106 | 8.0 x 8.0 | 13 x 12 | ±1μm |
| VC-15C-0.5-BLC | Matte Ceramic | Blue Chrome | 15 x 15 | 6 x 4.5 | 0.5 x 0.5 | 9 x 12 | ±2μm |
| VC-15C-0.75-BLC | Matte Ceramic | Blue Chrome | 15 x 15 | 9 x 0.75 | 0.75 x 0.75 | 9 x 12 | ±2μm |
| VC-15C-1.0-BLC | Matte Ceramic | Blue Chrome | 15 x 15 | 12 x 9.0 | 1.0 x 1.0 | 9 x 12 | ±2μm |
| VC-25C-1.5-BLC | Matte Ceramic | Blue Chrome | 25 x 25 | 18 x 13.5 | 1.5 x 1.5 | 9 x 12 | ±2μm |
| VC-30C-2.0-BLC | Matte Ceramic | Blue Chrome | 30 x 30 | 26 x 24 | 2.0 x 2.0 | 13 x 12 | ±2μm |
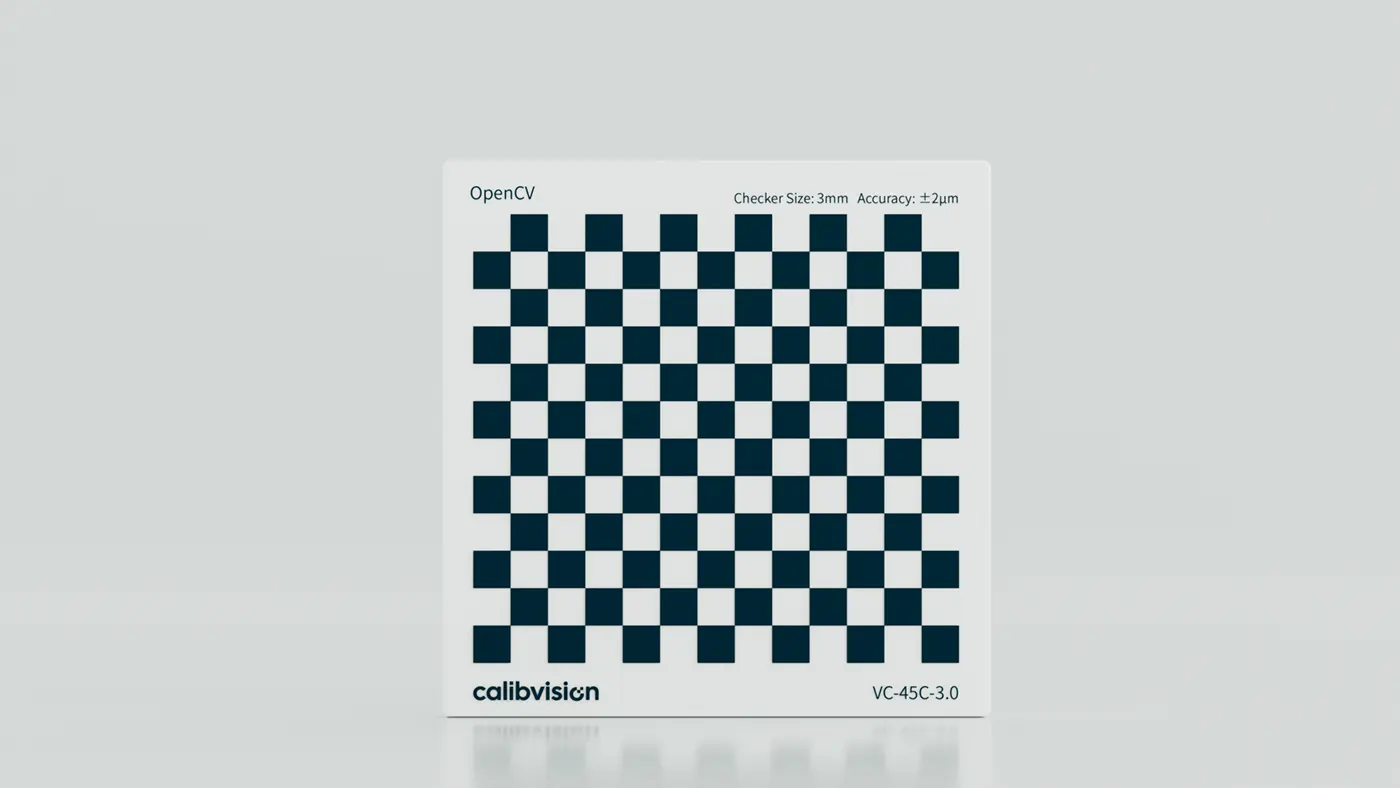
| VC-45C-3.0-BLC | Matte Ceramic | Blue Chrome | 45 x 45 | 39 x 36 | 3.0 x 3.0 | 13 x 12 | ±2μm |
| VC-60C-4.0-BLC | Matte Ceramic | Blue Chrome | 60 x 60 | 52 x 48 | 4.0 x 4.0 | 13 x 12 | ±2μm |
| VC-88C-6.0-BLC | Matte Ceramic | Blue Chrome | 88 x 88 | 78 x 78 | 6.0 x 6.0 | 13 x 12 | ±2μm |
| VC-111C-8.0-BLC | Matte Ceramic | Blue Chrome | 111 x 106 | 106 x 106 | 8.0 x 8.0 | 13 x 12 | ±2μm |
| VC-15QG-0.5-BLC | Quartz Glass | Blue Chrome | 15 x 15 | 6 x 4.5 | 0.5 x 0.5 | 9 x 12 | ±0.3μm |
| VC-15QG-0.75-BLC | Quartz Glass | Blue Chrome | 15 x 15 | 9 x 0.75 | 0.75 x 0.75 | 9 x 12 | ±0.3μm |
| VC-15QG-1.0-BLC | Quartz Glass | Blue Chrome | 15 x 15 | 12 x 9.0 | 1.0 x 1.0 | 9 x 12 | ±0.3μm |
| VC-25QG-1.5-BLC | Quartz Glass | Blue Chrome | 25 x 25 | 18 x 13.5 | 1.5 x 1.5 | 9 x 12 | ±0.3μm |
| VC-30QG-2.0-BLC | Quartz Glass | Blue Chrome | 30 x 30 | 26 x 24 | 2.0 x 2.0 | 13 x 12 | ±0.3μm |
| VC-45QG-3.0-BLC | Quartz Glass | Blue Chrome | 45 x 45 | 39 x 36 | 3.0 x 3.0 | 13 x 12 | ±0.3μm |
| VC-60QG-4.0-BLC | Quartz Glass | Blue Chrome | 60 x 60 | 52 x 48 | 4.0 x 4.0 | 13 x 12 | ±0.3μm |
| VC-88QG-6.0-BLC | Quartz Glass | Blue Chrome | 88 x 88 | 78 x 78 | 6.0 x 6.0 | 13 x 12 | ±0.3μm |
| VC-111QG-8.0-BLC | Quartz Glass | Blue Chrome | 111 x 106 | 106 x 106 | 8.0 x 8.0 | 13 x 12 | ±0.3μm |
| Accuracy Properties | |||
|---|---|---|---|
| Dot Diameter Accuracy | ±1μm |
Dot Spacing Accuracy (Any 2 Neighbor Features) |
±1μm |
|
Dot Position Accuracy
(Entire Pattern Area against ideal position) |
±1μm (Dimension <= 300mm) |
Distance Accuracy
(from Chrome Pattern to Target Edge) |
±0.05mm, ±0.1mm |
| Optical Properties | |||
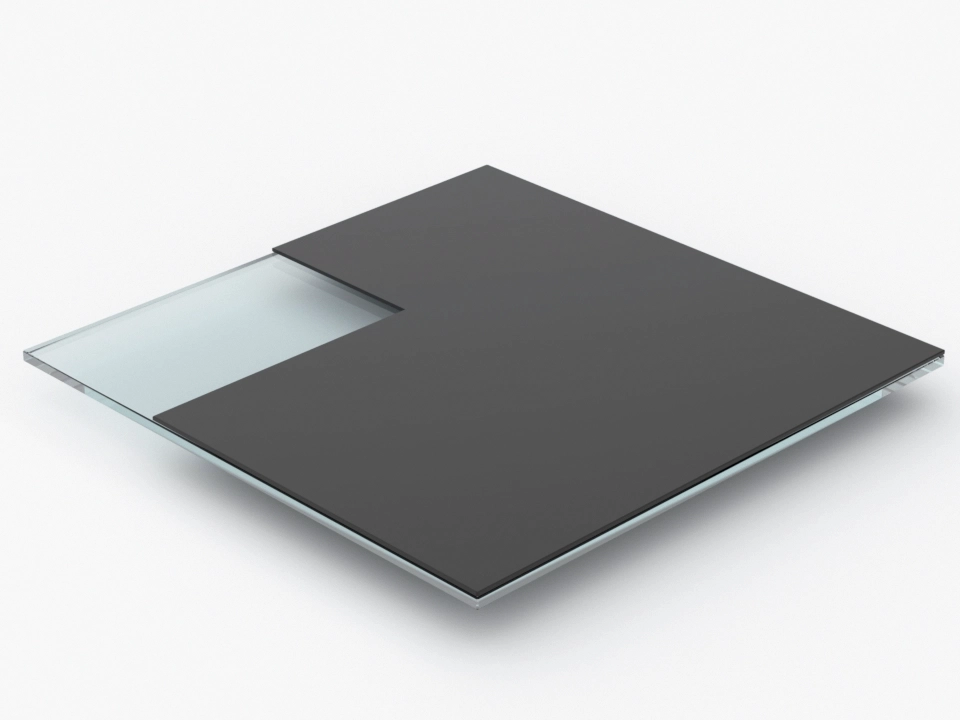
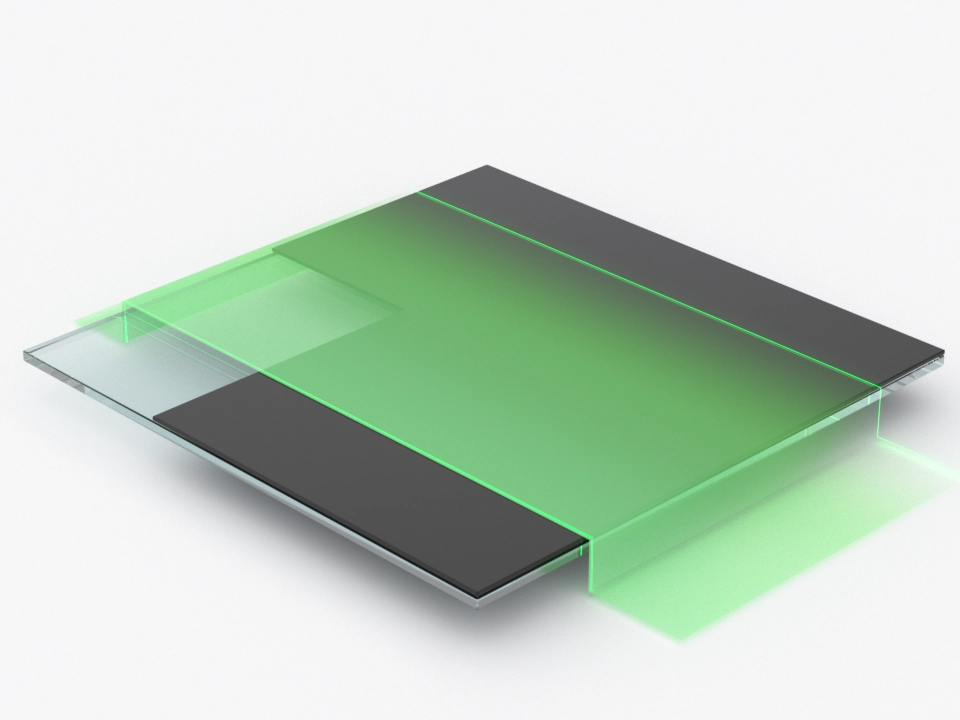
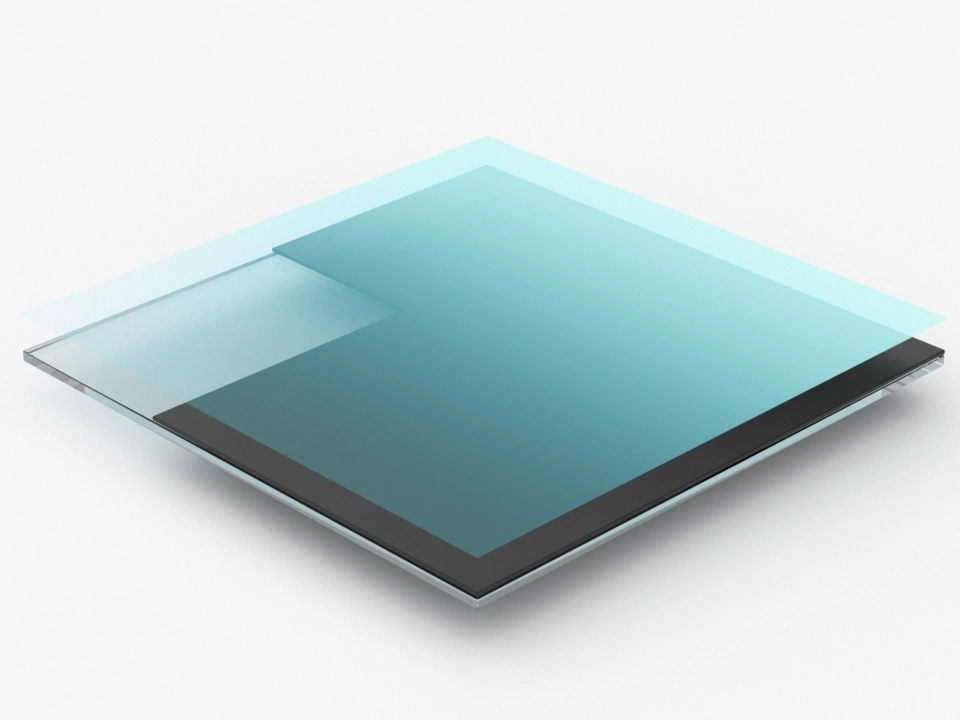
| Coating Type |
Bright Chrome (High Reflective) |
Brown Chrome (Low Reflective) |
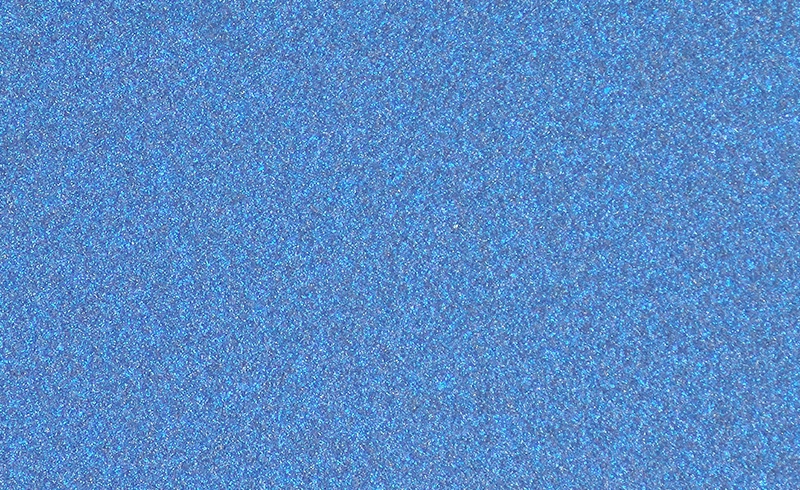
Blue Chrome (Ultra-Low Reflective) |
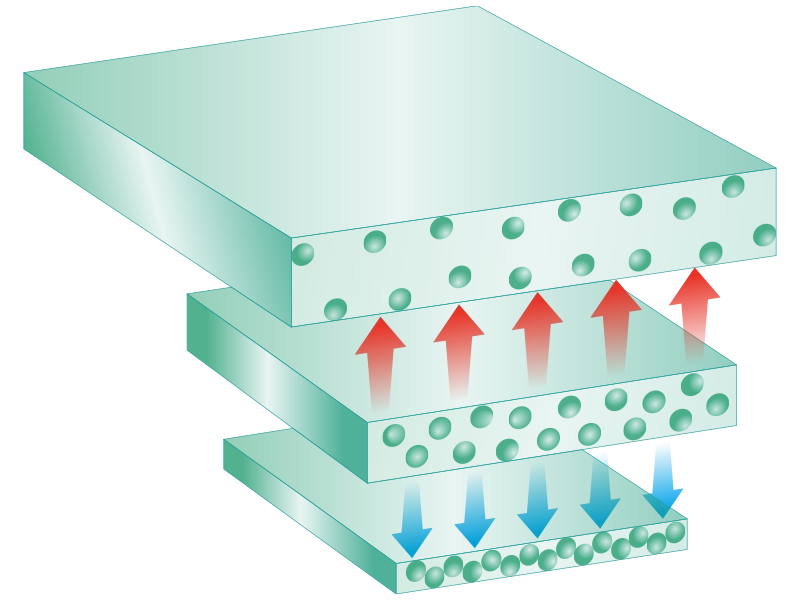
| Reflectivity | < 76.4% @550nm | <10% @550nm | < 17% @550nm |
| < 74.5% @650nm | < 17.4% @650nm | < 74.5% @750nm | |
| < 74.5% @750nm | < 17.4% @750nm | < 5.8% @750nm | |
| Coating Thickness | 120nm (±0.20nm) | 100nm (±0.20nm) | 120nm (±0.20nm) |
| Optical Density | OD>3.0 | OD>3.0 | OD>4.5 |
| Physical & Mechanical Properties | |||
| Substrate Material | Soda Lime Glass (Float Glass) | Quartz Glass (Fused Silica) | |
| Transmission (@550nm) | >90% | >95% | |
| Thermal Expansion Coeff (20~200℃) | 8.0 × 10⁻⁶ /K | <5.0x10⁻⁷/K | |
| Expansion Ratio (20~200℃) | 0.00085% (8.5μm/℃ of 1m) | 0.00006% (0.6μm/℃ of 1m) | |
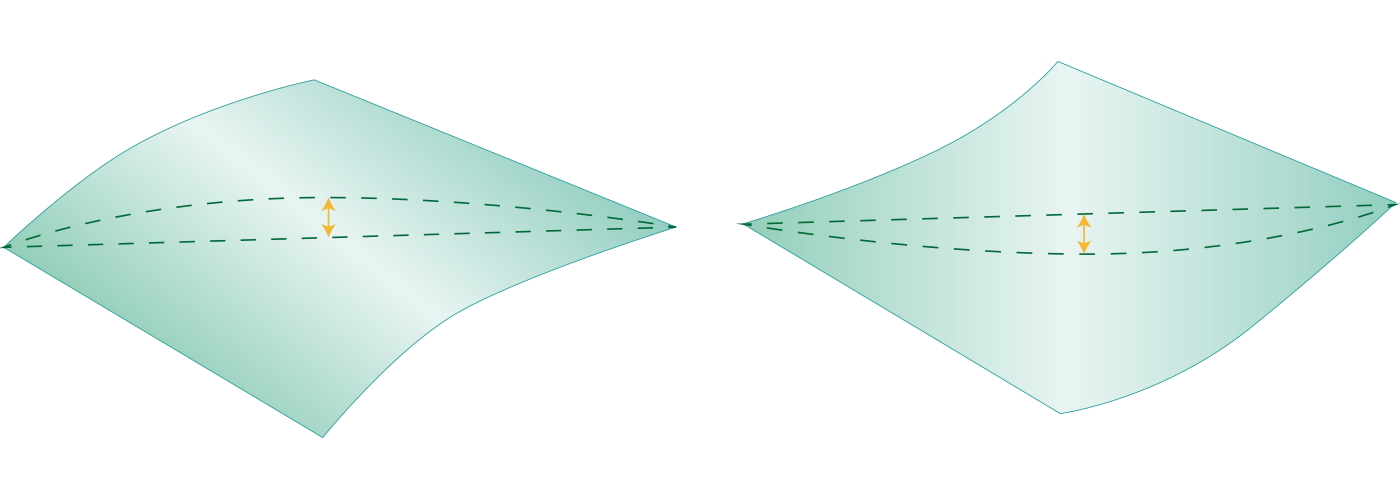
| Surface Flatness | <5μm (Dimension<100mm) | <1μm (Dimension<50mm) | |
| <20μm (Dimension<200mm) | <2μm (Dimension<100mm) | ||
| <50μm (Dimension>200mm) | <5μm (Dimension>200mm) | ||
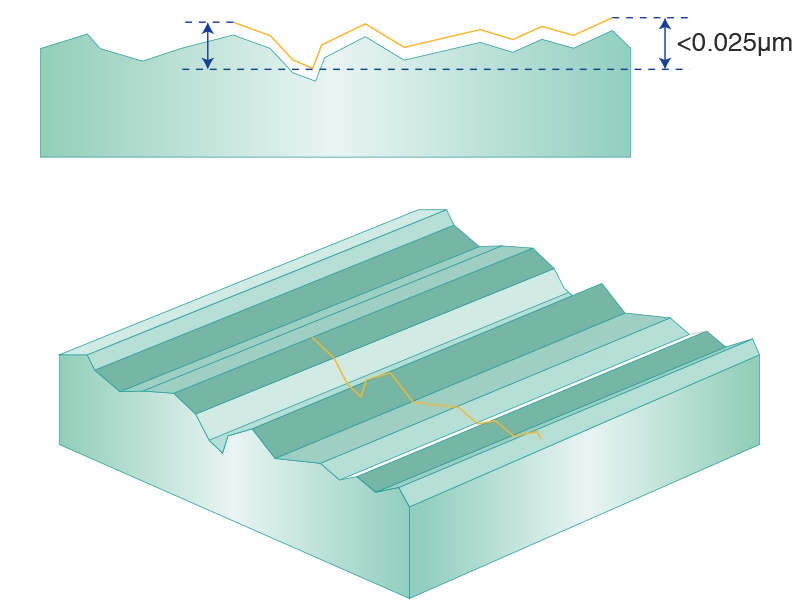
| Surface Roughness | <0.025μm | ||
| Thickness(mm) | 1.0mm/1.6mm/2.3mm/3.0mm/4.0mm (±0.1mm) options | ||
| Overall Dimension Tolerance(mm) | ±0.05mm, ±0.1mm | ||
| Regulatory Compliance | |||
| ISO9001 | Verified | RoSH 2015 | Compliant |
| Reach 235 | Compliant |
Accuracy Certificate (3rd Party/ CalibVision) |
Available on Request |
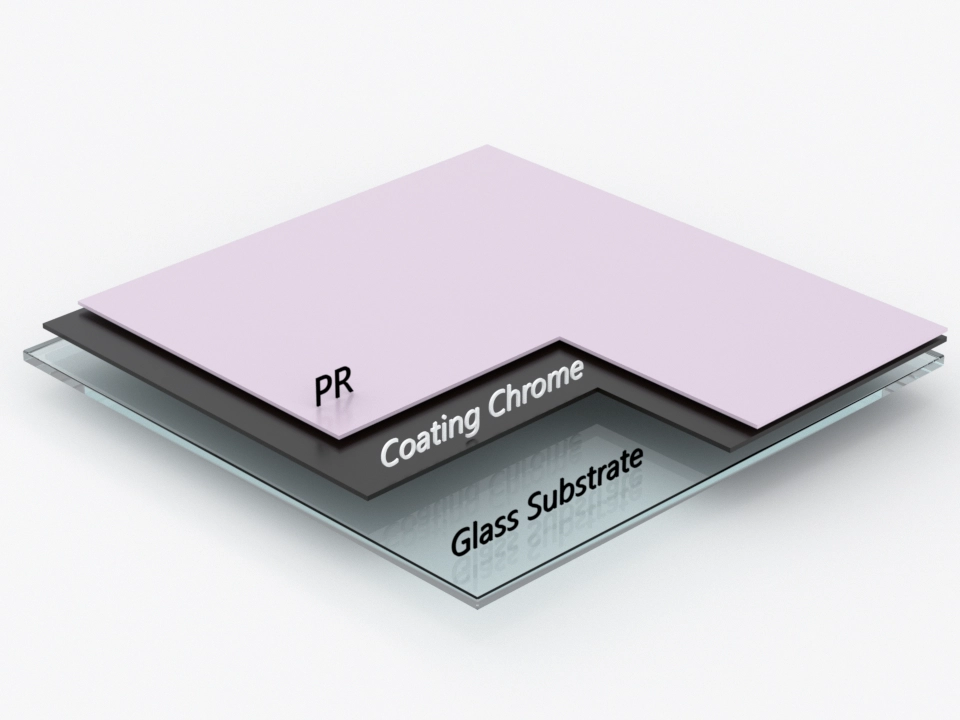
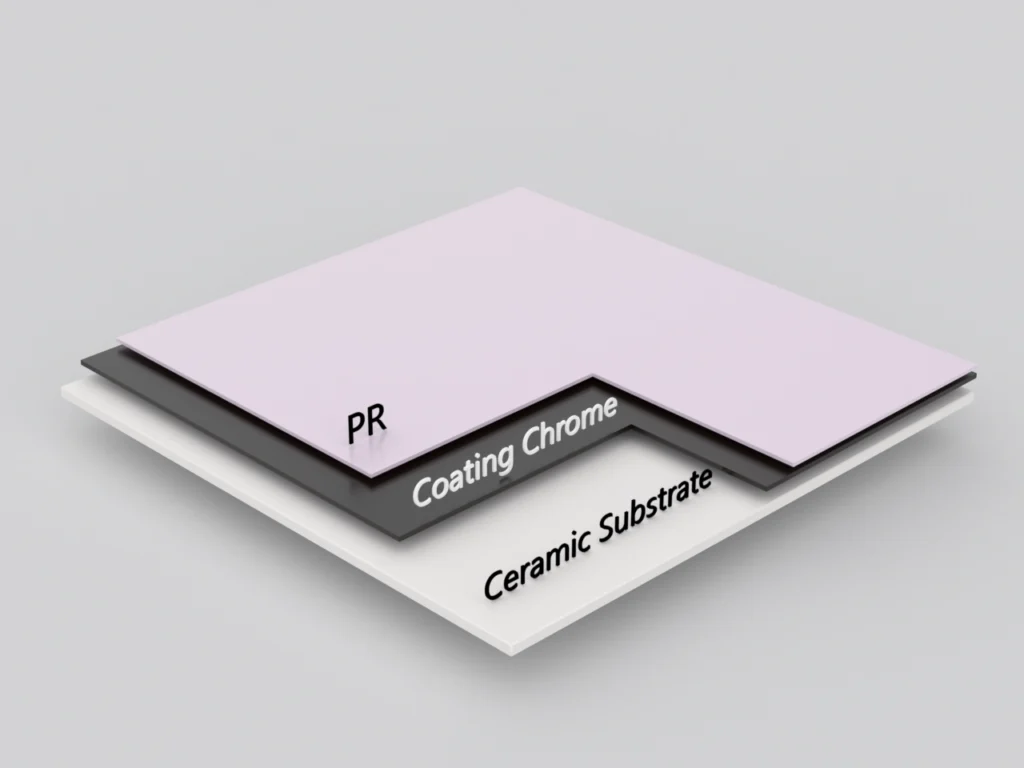
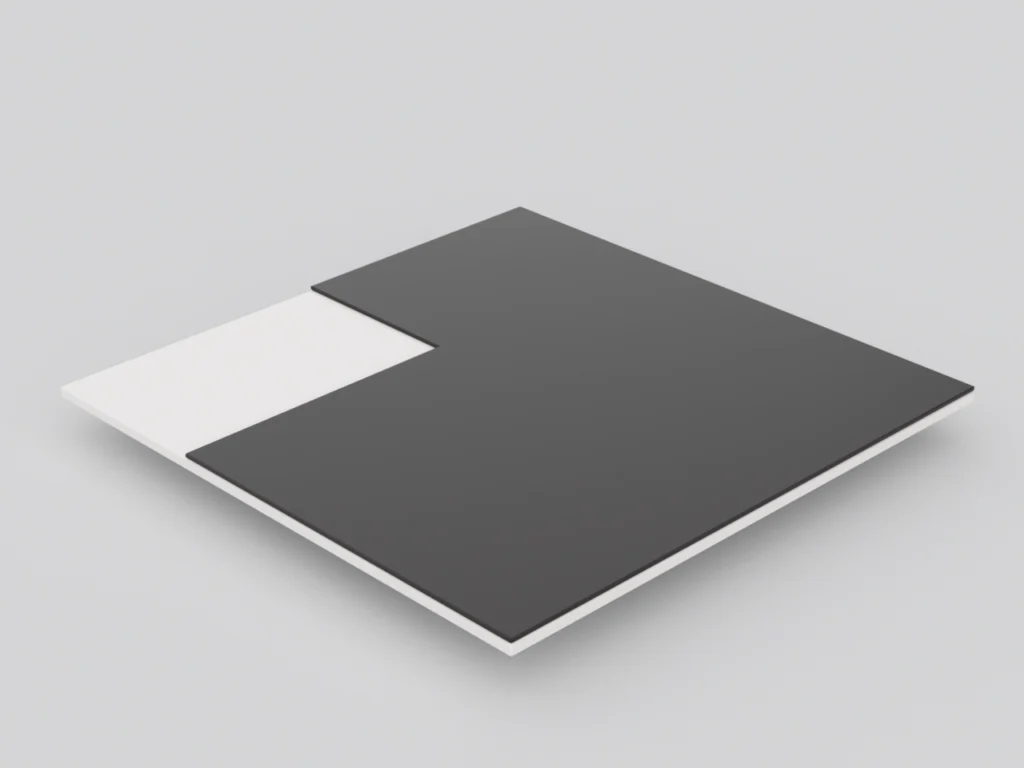
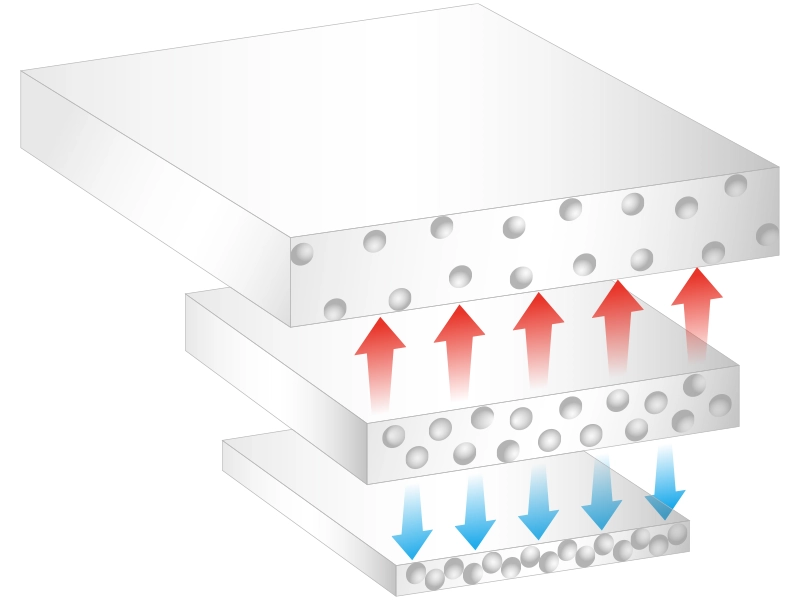
We start with high-quality soda-lime glass or ceramic substrates to ensure stability and long-term precision.
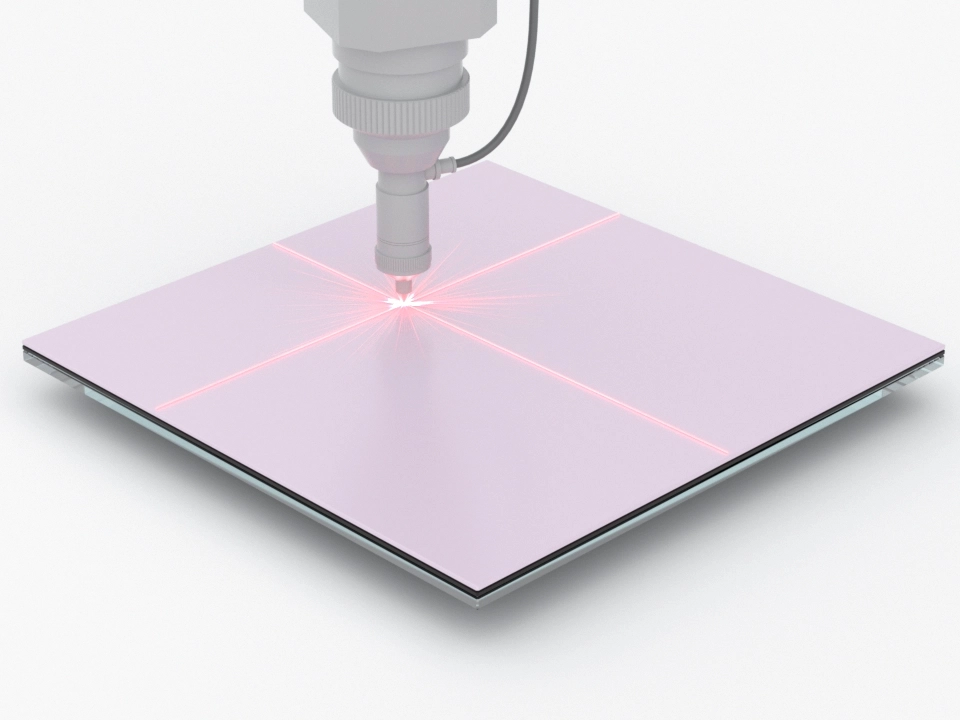
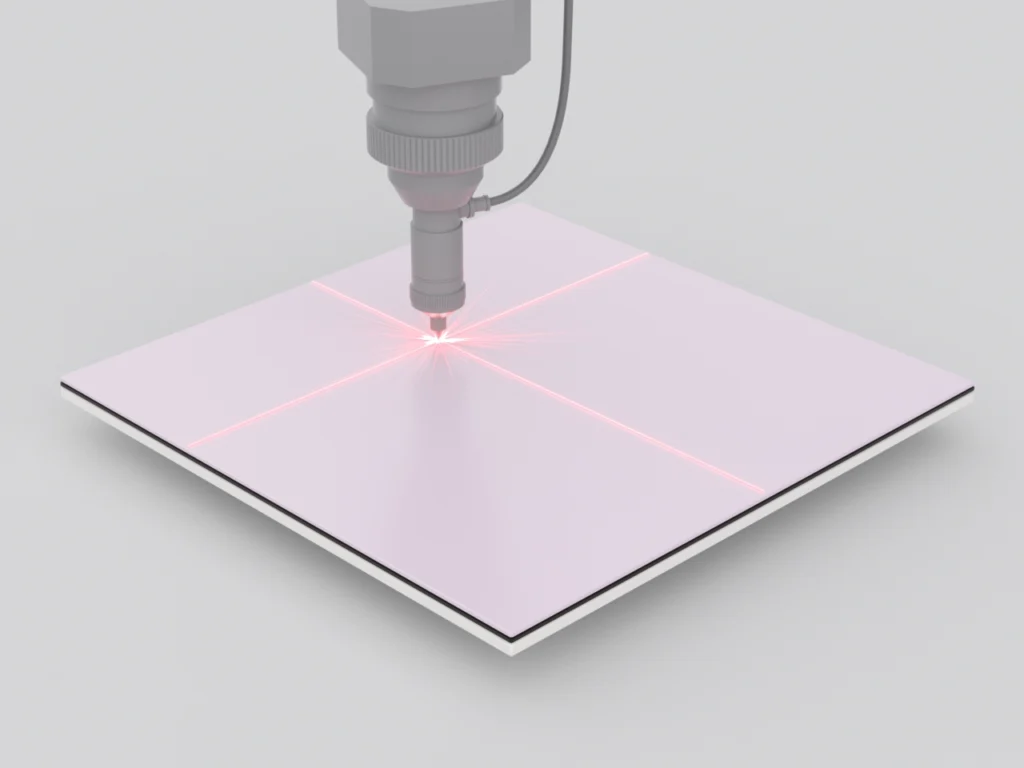
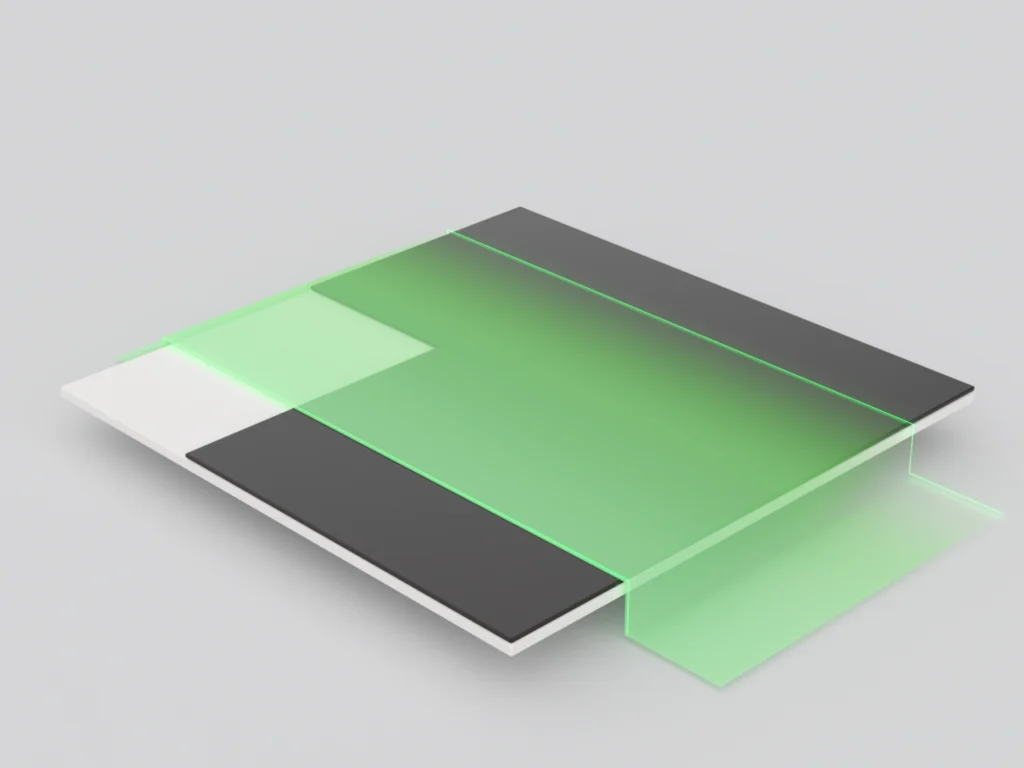
The calibration pattern is written onto the coated chrome layer using a high-precision laser system for consistent accuracy.
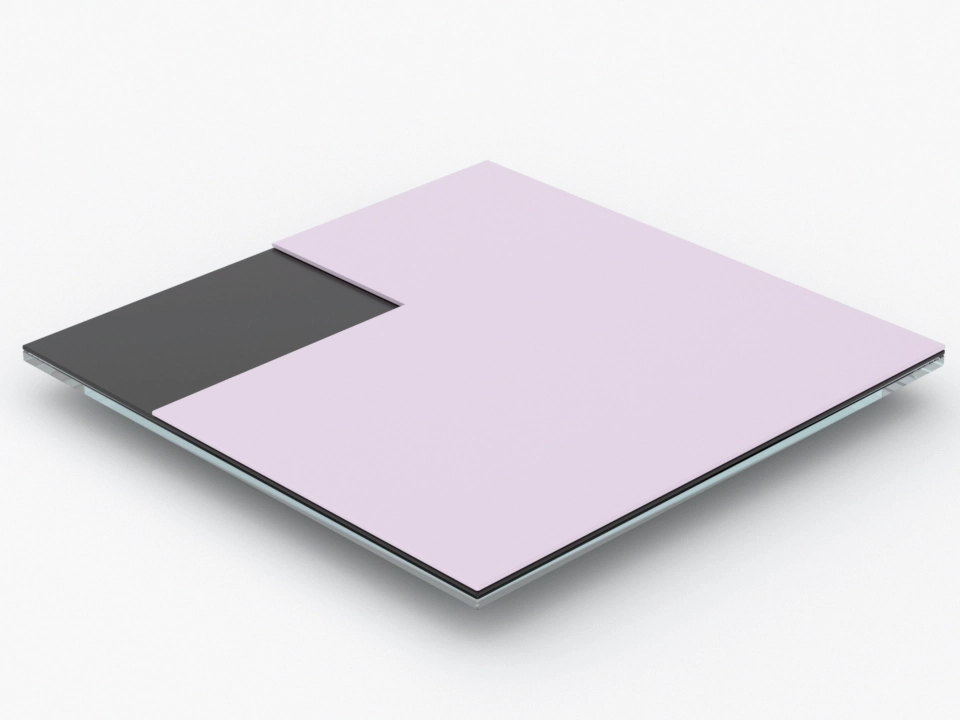
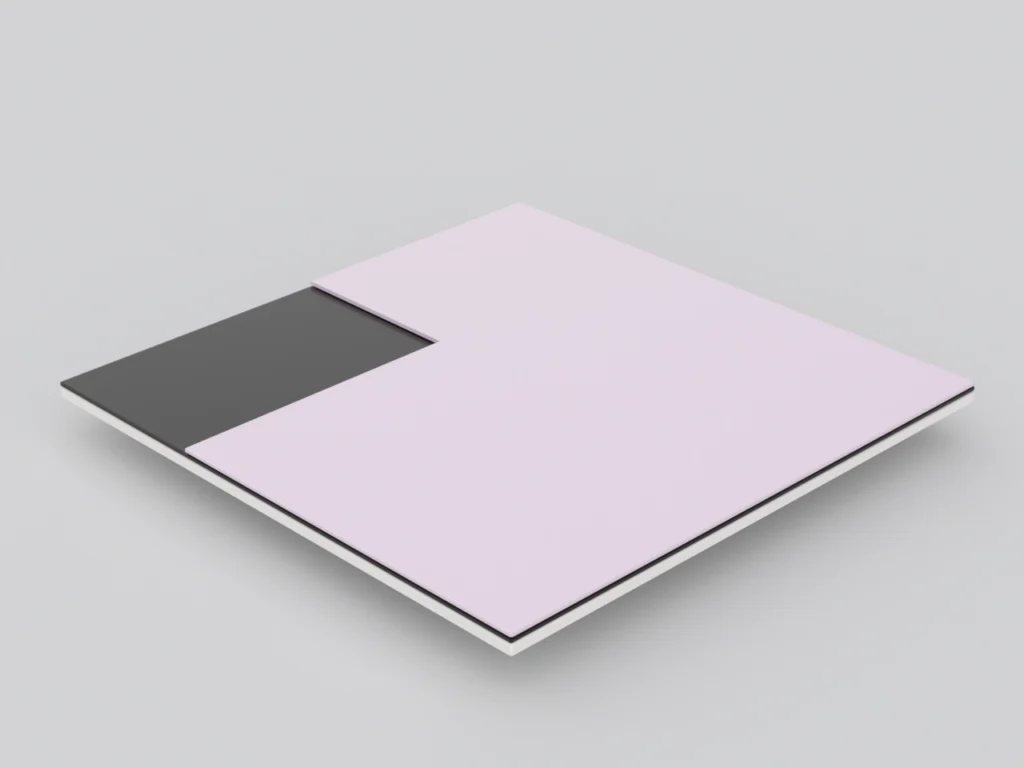
The exposed areas are developed to reveal the pattern structure.
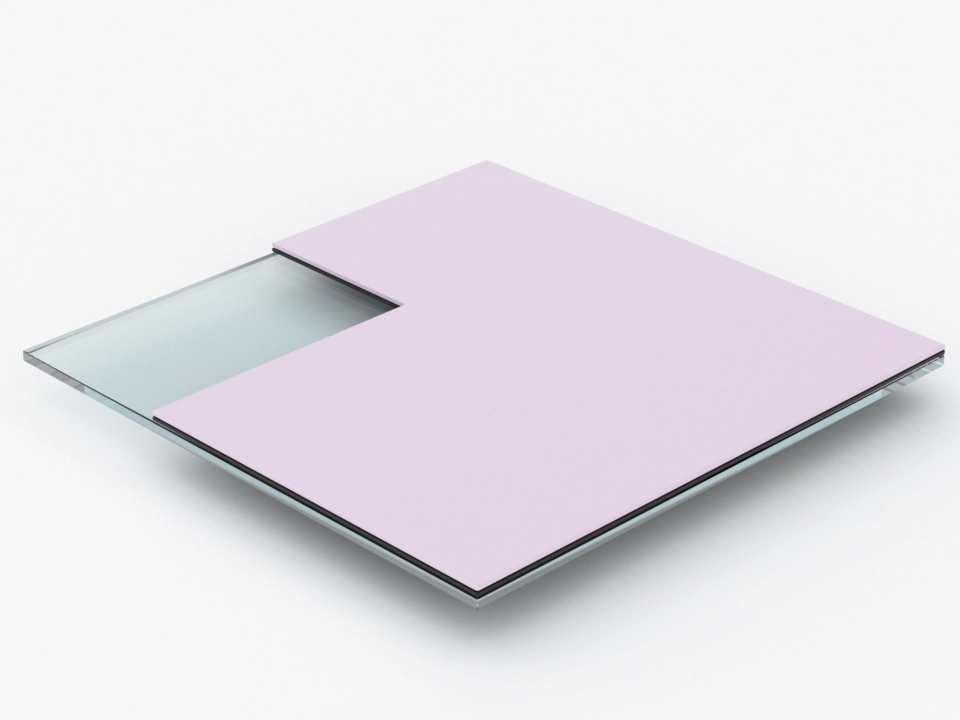
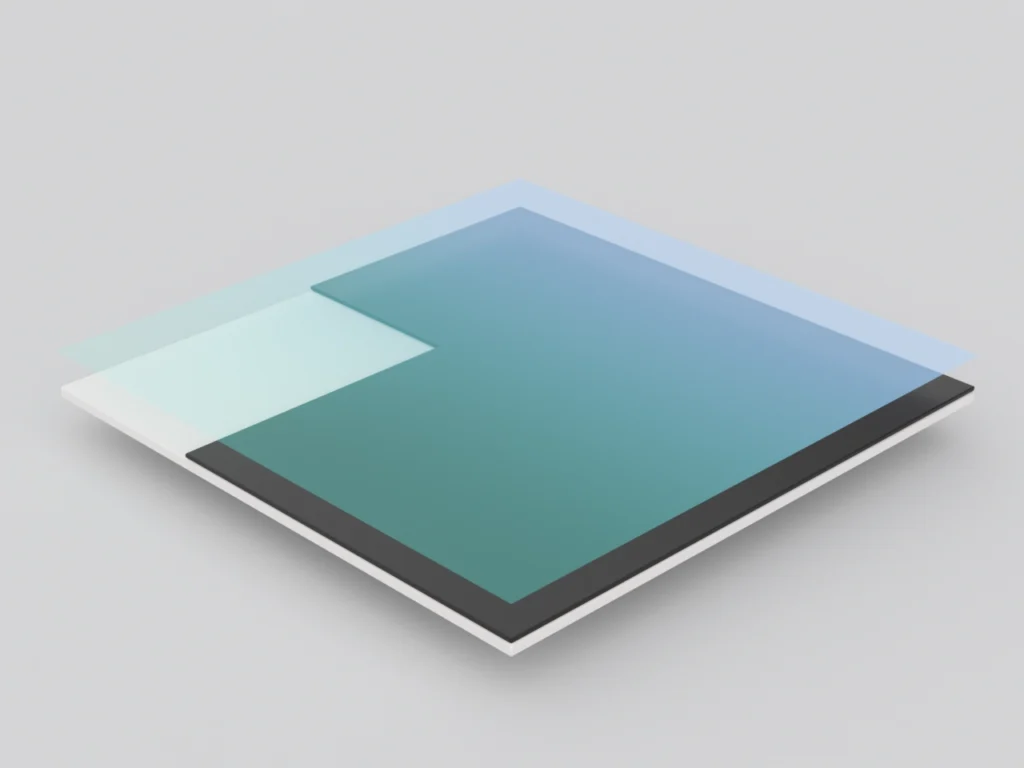
The chrome layer is etched to form clean, high-contrast features with sharp edges.
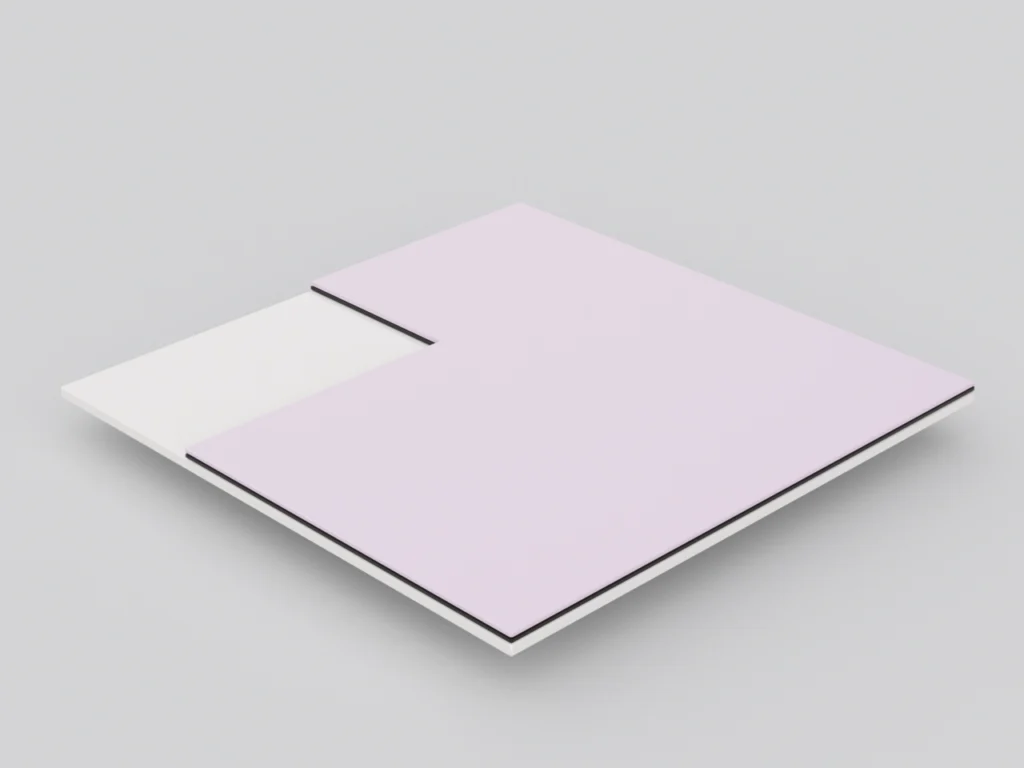
Residual photoresist and impurities are removed to achieve a smooth, flawless surface.
Each target is carefully inspected. Any defects are corrected to maintain micron-level accuracy.
A protective pellicle film can be added to prevent dust contamination, especially for demanding environments.
Every calibration target undergoes strict quality checks to ensure it meets industrial precision standards before shipment.
see why quartz glass is the premium choice for ultra-precicion applications
| Property |
|---|
| Thermal Expansion |
| Feature Accuracy |
| Min Feature Size |
| Surface Flatness |
| Max Temperature |
| Transmission |
| Cost |
| Quartz Glass |
|---|
| <5x10⁻⁷/℃ |
| ±0.5μm |
| 0.5μm |
| ~5μm |
| 1100℃ |
| >93% |
| Premium |
| Soda Lime Glass |
|---|
| 85x10-7/℃ |
| ±1μm |
| 0.7μm |
| ~10μm |
| -300℃ |
| >90% |
| Standard |
| Ceramic |
|---|
| 7.2x10⁻⁷/℃ |
| ±2μm |
| 3μm |
| 10-80m |
| 80℃ |
| N/A (Opaque) |
| Moderate |
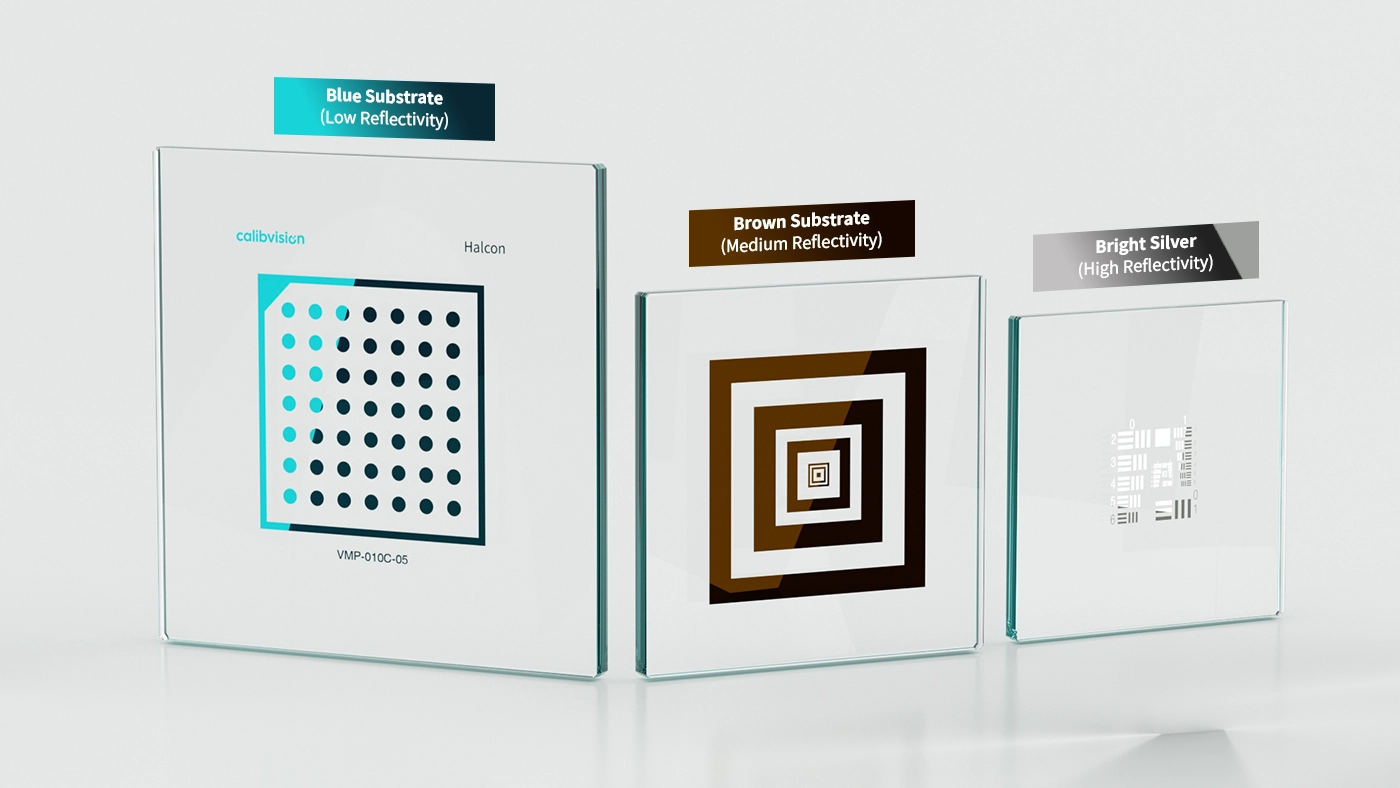
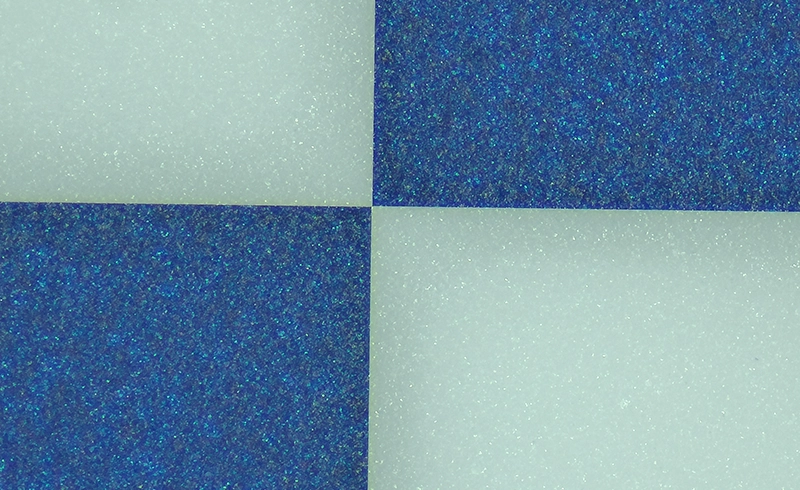
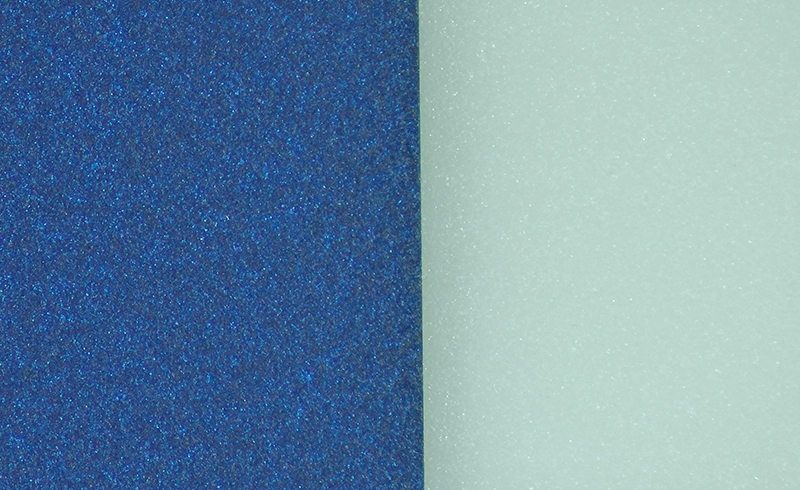
| Chrome Type | Blue Substrate | Brown Substrate | Bright Silver |
|---|---|---|---|
| Reflectivity | Low Reflectivity | Medium Reflectivity | High Reflectivity |
| Key Advantages |
Superior uniformity performance Minimizes ambient light interference Excellent contrast in low-light conditions |
Balanced reflectivity for versatile use Performs well under strong illumination Suitable for outdoor environments |
Maximum light reflection for low-light scenarios Enables faster positioning and detection Ideal for high-speed applications |
Glass expands when heated and contracts when cooled.
| Parameters | Quartz Glass (Fused Silica) | Soda Lime Glass (Float Glass) |
|---|---|---|
| Thermal Expansion Coeff (15-200'C) | <8.0x10⁻⁷/K | <5.0x10⁻⁷/K |
| Expansion Ratio (20-200C) | 0.00085% | 0.00006% |
| Real-World Expansion Impact of 1Meter | Im glass changes by 8.5um per 1℃ | Im glass changes by 0.6um per 1°C |
| Temperature Stability | Standard stability | 14x more stable |
| Best Applicationsy | General-purpose testing | Precision measurement systems |
One of the advantages of quartz glass is Low Thermal Expansion Rate (CTE): <5.0*107, it delivers superior thermal stability (0.55um/°C vs 8.5um/°C). Essential for precision measurements, optional for general testing applications.
Unless you need exceptional thermal stability, soda lime glass delivers excellent performance at a fraction of the cost of quartz glass.
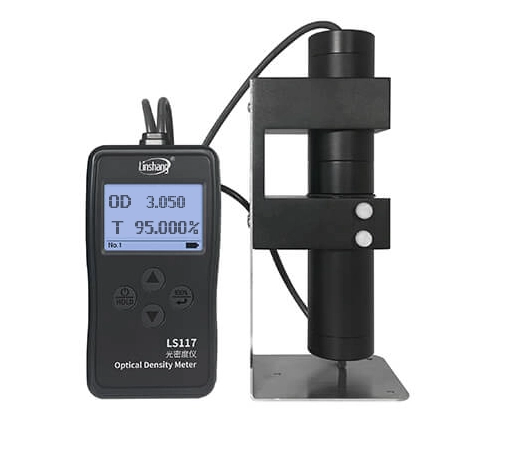
| Application Type | Required OD | Purpose |
|---|---|---|
| Standard Vision | OD 3-4 | General purpose calibration |
| High Precision | OD 4-5 | Sub-pixel accuracy requirements |
| NIR Applications | OD > 4.5 | Near-infrared wavelength optimization |
| Research Grade | OD> 5 | Ultimate contrast for specialized applicationsUltimate contrast for specialized applications |
| Glass Type | Soda Lime Glass (Standard Float Glass) | Quartz Glass (Fused Silica) |
|---|---|---|
|
Small Samples Surface Deviation |
<5μm (for sizes under 100mm) | <1μm (for sizes under 50mm) |
|
Medium Samples Surface Deviation |
<20μm (for sizes under 200mm) | <2μm (for sizes under 100mm) |
|
Large Samples Surface Deviation |
<50μm (for sizes over 200mm) | <5μm (for sizes over 100mm) |
| Accuracy Properties | |
|---|---|
|
Dot Diameter Accuracy (Minimum Line) |
±2μm |
|
Dot Position Accuracy (in Entire Pattern Area against ideal position) |
±2μm |
|
Dot Spacing Accuracy (Any 2 Neighbor Features) |
±1μm |
|
Distance Accuracy (from Chrome Pattern to Target Edge) |
±0.1mm |
| Production Process | Laser Writing |
| Optical Properties | |
| Substrate Material | Matte Ceramic/Glossy Ceramic |
| Coating Type | Blue Chrome |
| Reflectivity | < 7% @550nm |
| < 5% @650nm | |
| < 5% @750nm | |
| Coating Thickness | 100~120nm |
| Physical & Mechanical Properties | |
| Ceramic Substrate | 96% Alumina |
| Density | ≥ 3.66 g/cm³ |
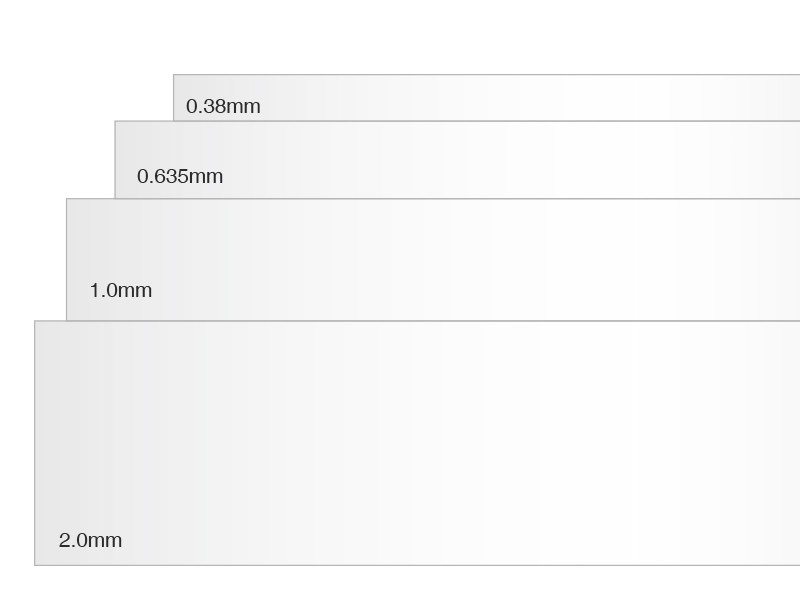
| Thickness | 1mm/2mm/0.38mm/0.635mm (±0.1mm) |
| Surface Flatness | <30μm (Dimension<100mm) |
| <60μm (Dimension: <200mm) | |
| 200mm) | |
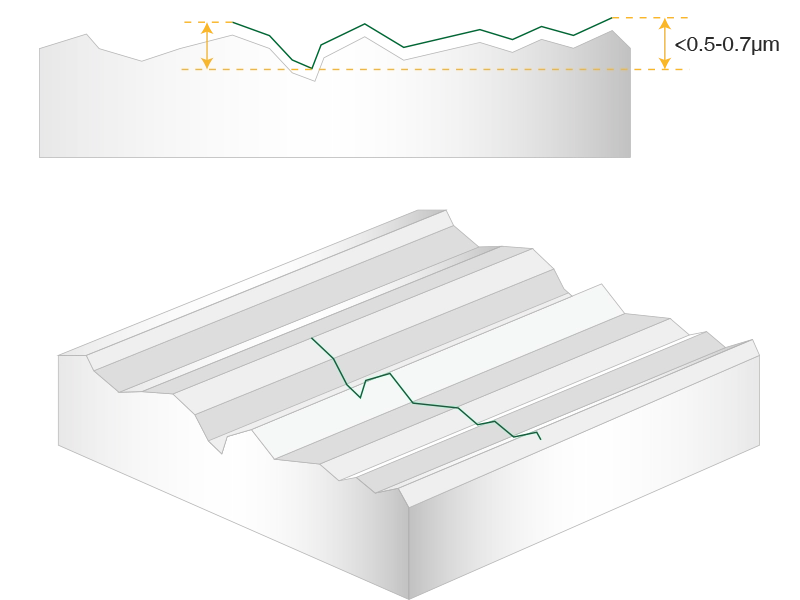
| Surface Roughness | <0.2-0.7μm |
| Thermal Expansion Coeff (40~400℃) | 6.7 × 10⁻⁶ /K |
| Regulatory Compliance | |
| ISO9001 | Verified |
| Reach 235 | Compliant |
| RoSH 2015 | Compliant |
|
Accuracy Certificate (3rd Party/CalibVision) |
Available on Request |
Minimum Line/space
Industries that demand the ultimate in calibration precision
| Coating Type | Matte Ceramic | Glossy Ceramic |
|---|---|---|
| Type |

|

|
| Minimum Line/space | 4μm | 2μm |
| Feature Accuracy | ±2μm | ±1μm |
| Overall Accuracy | ±2μm | ±1μm |
| Coating Type | Chrome | Chrome |
| Coating Glossy or Matte | Matte | Glossy |
The ceramic expand with heat and contract with cold.
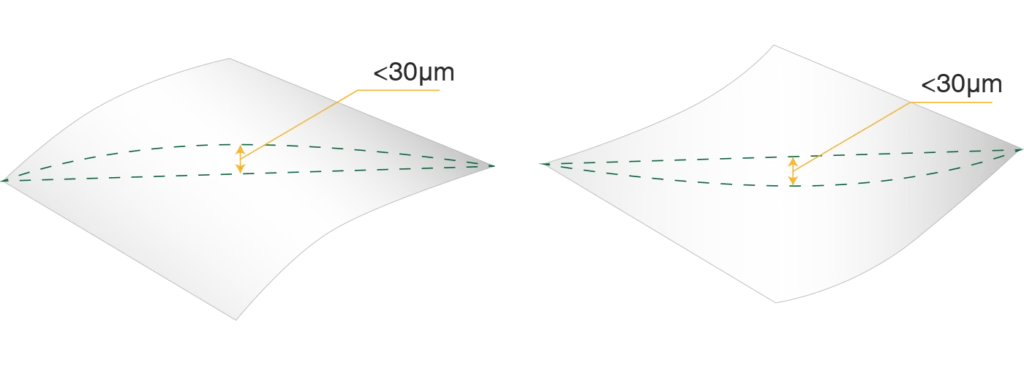
| Dimension | <100mm | <200mm | >200mm |
|---|---|---|---|
| Surface Flatness | <30μm | <60μm | <100μm |
The wrong target means failed calibrations and costly rework. CalibVision targets pass on the first attempt—guaranteed—with sub-micron precision, sharp corner definition, optical-grade contrast, and production durability.

Photolithography Process
Particle-free, Defect-free Coating
Crisp corners with high contrast
Enables sub-pixel detection accuracy
Optical-Grade Uniformity
Consistent coating across pattern
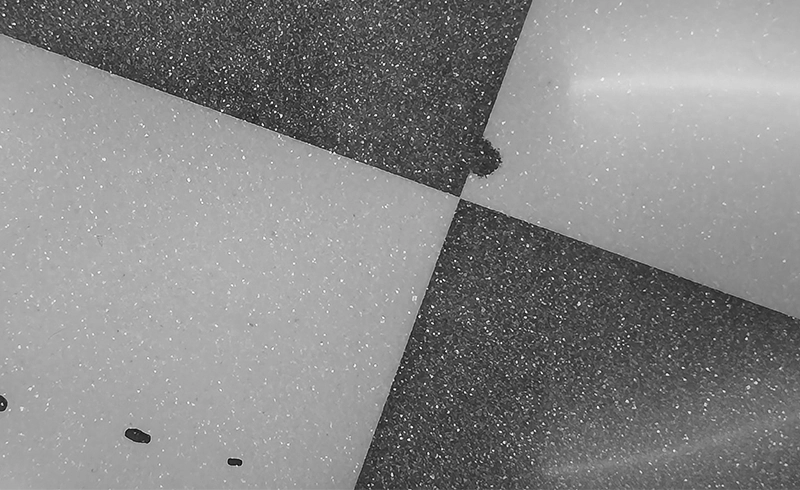
Printing process with ink bleeding
Visible particle defects and smudging
Fuzzy, poorly-defined corners
Low-contrast edges with ink bleeding
Inconsistent ink coverage
Uneven density, glare, and reflections
Please fill out the form below or email us directly to sales@calibvision.com, our sales engineers will review your request and get back to you within 24 hours(typically faster).
