
The Best Calibration Targets and Test Charts: A Complete Comparison by Use
A comparison of the most widely used calibration targets and test charts, organised by what they measure rather than lumped together. Geometric targets — checkerboard, ChArUco, dot grid, AprilGrid — solve camera geometry and distortion; resolution and image-quality charts — USAF 1951, ISO 12233, ISO 15739 — measure sharpness, resolution and noise. Definitions, applications, the software each pairs with, and where to buy.
USAF 1951 vs ISO 12233: Which Resolution Target Should You Use?
USAF 1951 and ISO 12233 both measure resolution, but differently: USAF is a visual, pass/fail limit in line pairs per millimetre from three-bar targets; ISO 12233 is an automated MTF/SFR curve from slanted edges. USAF suits optical hardware, microscopy and quick bench checks; ISO 12233 suits digital camera and lens image-quality testing. A neutral comparison to help you pick — with each pointing to the right target.
Optical Density vs Contrast Ratio: What 10:1 and 4:1 Really Mean
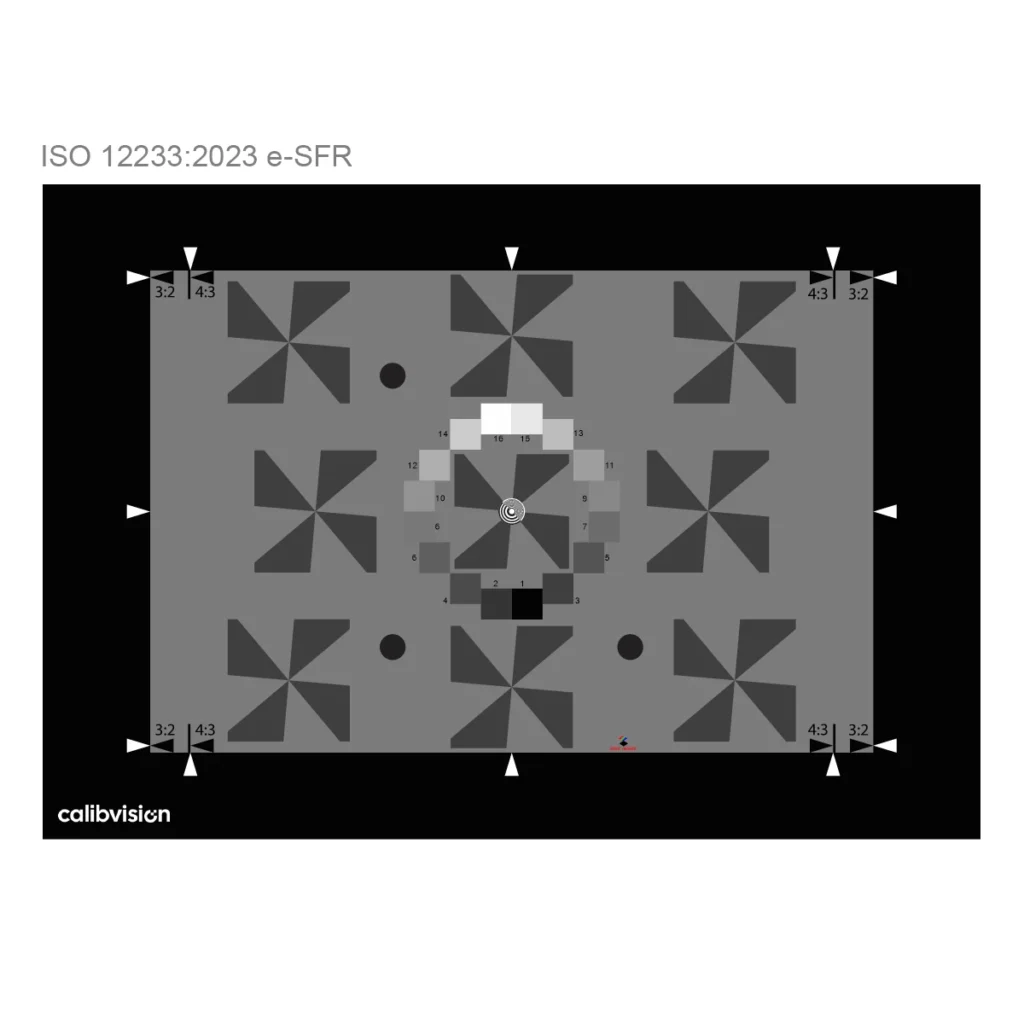
Optical density and contrast ratio describe the same thing, linked by one equation: contrast ratio = 10^(ΔOD). This article shows how to convert between them, why 10:1 = OD 1.0 and 4:1 ≈ OD 0.6, and why opaque chrome (OD 3 ≈ 1000:1) can never be a low-contrast target.
Why ISO 12233 Slanted-Edge MTF Requires a Low-Contrast Target (4:1 vs 10:1 vs High Contrast)
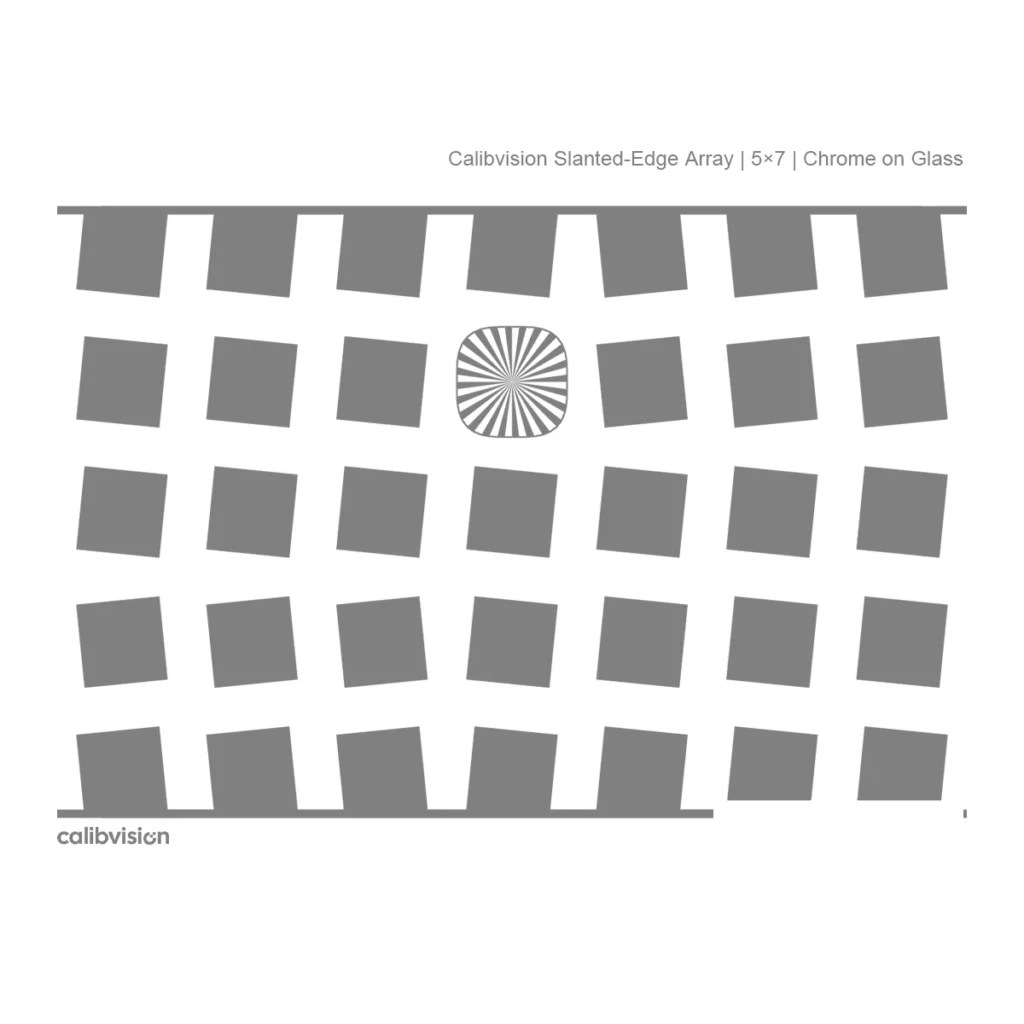
The slanted-edge method only gives a true MTF when the camera responds linearly. A high-contrast black-to-white edge clips and triggers sharpening, inflating the result. This article explains why ISO 12233’s low-contrast edge — about 4:1 — keeps the edge in the linear range, and compares 4:1, 10:1, and high-contrast targets.