USAF 1951 and ISO 12233 are the two standards most people reach for to measure resolution, and they are not interchangeable. USAF 1951 gives a single visual resolution limit — the finest three-bar element you can still resolve, read out in line pairs per millimetre. ISO 12233 gives a full MTF curve — how contrast falls off across spatial frequencies, computed automatically from a slanted edge. One is a pass/fail limit; the other is a continuous response. This guide compares them neutrally so you can pick the right one, and points each to the target it needs.
What USAF 1951 measures
A USAF 1951 target is a set of three-bar elements that shrink in defined steps. You find the smallest element whose three bars are still clearly separated, read its group and element, and convert to lp/mm. It is visual and fast: no software is required, the answer is a single limiting-resolution number, and the pattern is the long-standing common language of optical hardware. The trade-off is that the reading is a subjective threshold — where you judge the bars “just resolved” (the Rayleigh criterion puts this near 26.4% contrast) — and it gives you one point, not the whole response. The standard pattern tops out at Group 9 Element 3, 912.30 lp/mm. For the full method, see how to read a USAF 1951 chart.
What ISO 12233 measures
ISO 12233 uses the slanted-edge (e-SFR) method: a tilted high-contrast edge is super-sampled to recover a fine edge profile, which is transformed into a Spatial Frequency Response — an MTF curve showing contrast at every spatial frequency, not just the limit. It is automated and objective (analysed in software such as Imatest), repeatable, and can be measured at many field positions at once, which makes it the standard for digital camera and lens image-quality work. The trade-off is that it needs the chart, the software and a controlled setup — more overhead than glancing at a bar target on a bench. For the chart itself, see the ISO 12233 chart comparison.
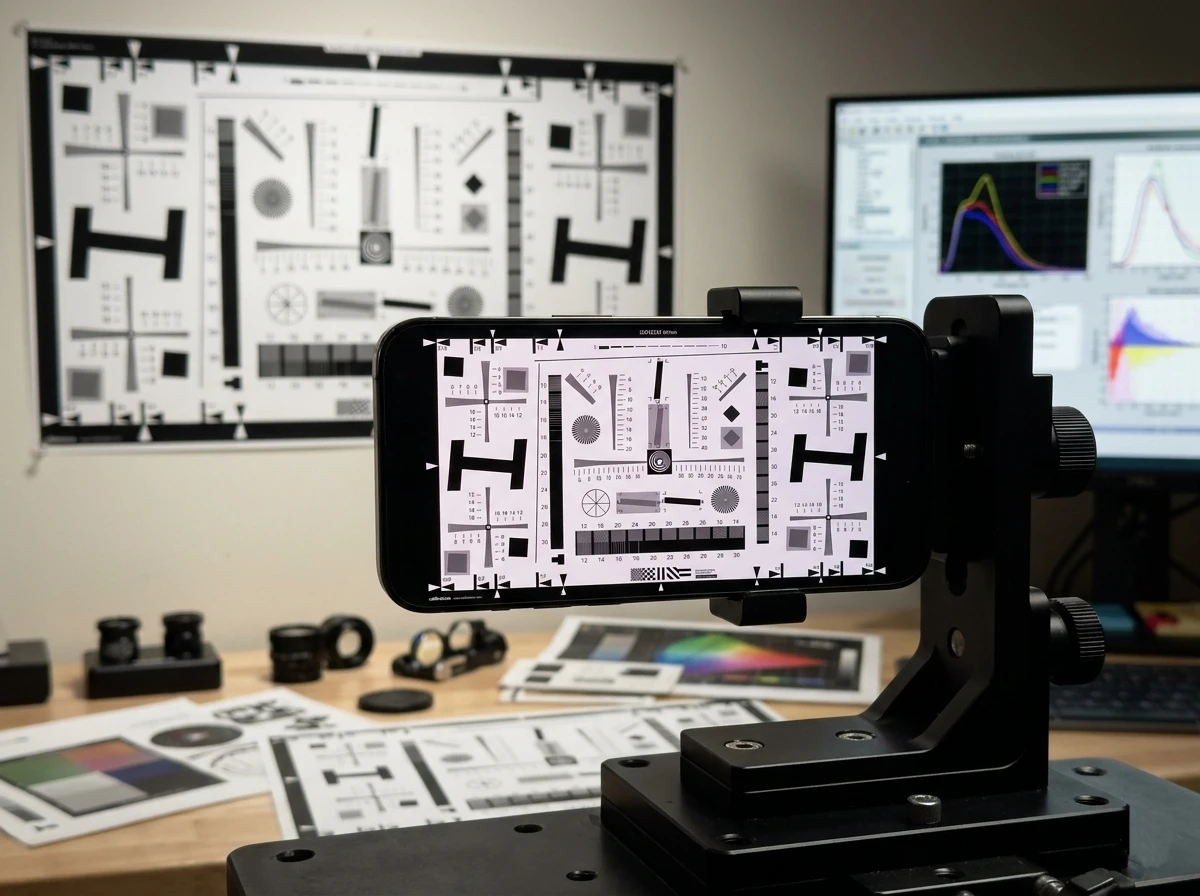
Side by side
| USAF 1951 | ISO 12233 | |
|---|---|---|
| Pattern | Three-bar elements | Slanted edges (e-SFR) |
| Result | Single limit, lp/mm | Full MTF curve vs frequency |
| Reading | Visual, pass/fail threshold | Automated, objective |
| Software | None required | Imatest or equivalent |
| Field coverage | Where you place the target | Many positions at once |
| Best for | Optical hardware, microscopy, bench checks | Digital camera & lens systems |
| Origin | MIL-STD-150A (1951) | ISO 12233 (current 2017/2023) |
Which one should you use?
The decision comes down to what you are testing and how you want the answer:
- Choose USAF 1951 for optical hardware — lenses, objectives, telescopes, relays — and for microscopy, where it is the established standard, and for quick bench checks where a single limiting number and no software is exactly what you want.
- Choose ISO 12233 for digital camera and lens systems, where you need an objective, repeatable MTF curve across the field for comparison, tuning, or production QC.
They are not mutually exclusive. Many labs keep both: a USAF target for a fast resolving-power check at the optical bench, and an ISO 12233 chart for full image-quality characterisation of the finished camera. Digital-camera testing has largely standardised on ISO 12233 (and on ISO 15739 for noise), while USAF 1951 remains the lingua franca for optical components.
Accuracy comes from the target, not the standard
Whichever you use, the number is only as good as the physical target. A USAF chart on photolithographic chrome-on-glass gives sub-micron bar edges — soda-lime with brown chrome to ±50 nm, or quartz with blue chrome to ±20 nm for the finest groups and UV. An ISO 12233 chart needs clean, high-contrast slanted edges on a stable substrate; a printed chart’s fuzzy edges cap the SFR you can measure. Every CalibVision target ships with a serial-numbered inspection report; measurements are NIST/NIM-traceable, with product-level traceability under CNAS L0579 and ILAC-MRA.
How do I get the right target?
If you are testing optical hardware or working under a microscope, a chrome-on-glass USAF 1951 target is the right tool — positive or negative, soda-lime or quartz. If you are characterising a digital camera or lens system, an ISO 12233 e-SFR chart is what you need. Tell us your device and method and we will confirm which, and the substrate and size.