A reflectance target is only as good as the number printed for it. If a panel sold as 10% really reflects 12% at your laser wavelength, every range and intensity result measured against it carries that error, and nothing in your own data will reveal it.
The test report is where that number is proven.
A reflectance target test report should show, for the individual panel you received, the measured reflectance at your LiDAR wavelength, the measurement geometry, the reference standard it traces to, and how uniform the surface is across the panel.
This article walks through eight checks, using a real Calibvision sample report as the example. You can download the full report and read along.
What a Reflectance Target Test Report Contains
Most reports follow the same order. Table 1 lists the sections, what each one tells you, and what our sample shows. The sample covers two small diffuse reflectance targets (204 × 140 mm) measured from 380 to 1000 nm.
| Section | What it tells you | In the sample report |
|---|---|---|
| Test summary | Which units, what range, the headline result | 2 units with serial numbers, 380–1000 nm, means of 53.26% and 53.27% |
| Reference standard and traceability | What the measurement was compared against | Reference white calibrated by the National Institute of Metrology, China (NIM) |
| Equipment and method | Instrument, geometry, procedure | 8° integrating sphere, quartz halogen source, 10 nm interval |
| Measurement grid | Where on the surface it was measured | 9 positions in a 3 × 3 grid |
| Spectral data | Reflectance at each wavelength and position | 63 wavelengths × 9 positions per unit |
| Uniformity summary | The spread across the surface | Largest deviation 0.15 points from the mean |
| Conformance statement | Pass or fail against the stated tolerance | Pass |
Eight Checks Before You Accept a Report
1. The serial number matches your panel
A report is evidence only for the unit it was measured on. Look for a serial number on the report and the same number on the panel label.
“Typical” or batch data tell you what the coating usually does. They do not tell you what your panel does. In the sample, each of the two units has its own data table and its own mean: 53.26% and 53.27%.
2. The wavelength range covers your laser
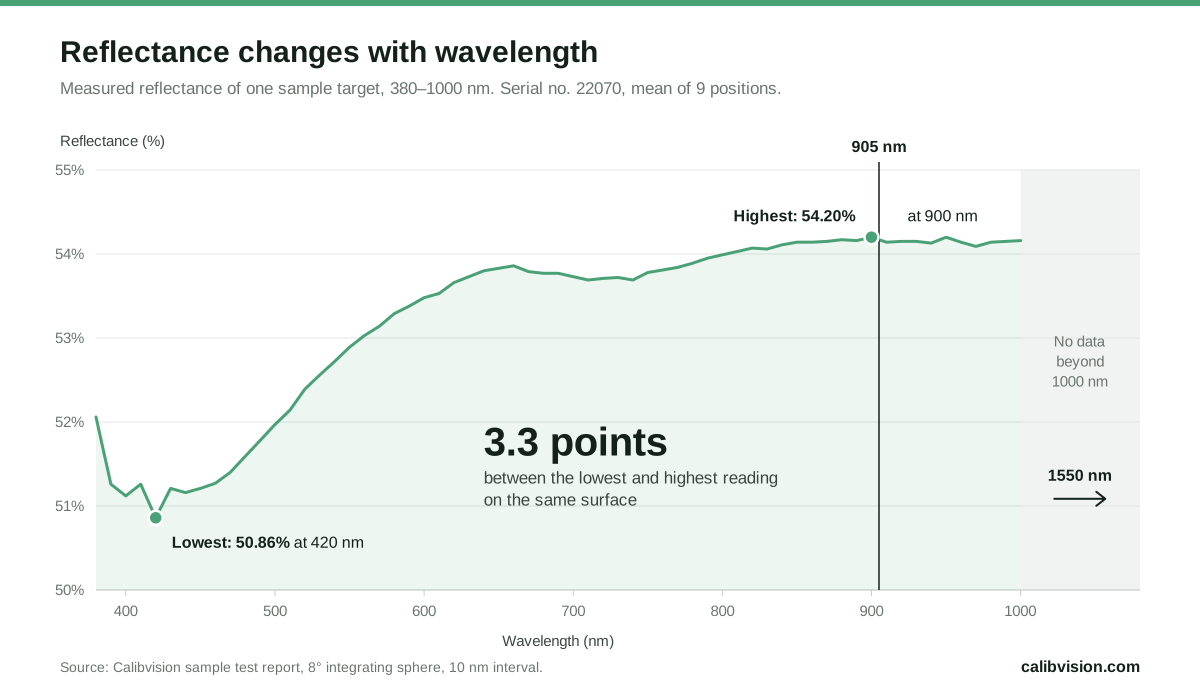
Reflectance changes with wavelength. In the sample report, the same surface reads 50.86% at 420 nm and 54.20% at 900 nm, a spread of more than three points on one panel. A value measured in visible light cannot simply be carried over to 905 nm or 1550 nm.
| Wavelength | Mean of 9 positions | Lowest position | Highest position |
|---|---|---|---|
| 450 nm | 51.21% | 51.04% | 51.39% |
| 550 nm | 52.89% | 52.84% | 52.99% |
| 650 nm | 53.83% | 53.77% | 53.86% |
| 850 nm | 54.14% | 54.11% | 54.19% |
| 900 nm | 54.20% | 54.14% | 54.25% |
| 910 nm | 54.14% | 54.09% | 54.20% |
| 1000 nm | 54.16% | 54.09% | 54.29% |
Check that the range on the report includes your lidar wavelength, then look at the data interval. The sample reports every 10 nm, so 905 nm sits between the 900 nm and 910 nm rows. It stops at 1000 nm. A 1550 nm lidar needs a report measured on an instrument that covers that band. If that is what you need, ask us for a 905 nm or 1550 nm sample report.
3. The measurement geometry is stated
The sample was measured with an 8° integrating sphere. Light strikes the surface at 8° from normal, and the sphere collects the reflection over the whole hemisphere. Hemispherical geometry is a standard spectrophotometric method, covered by ASTM E1331.
A lidar does not collect a hemisphere. It receives only the light that comes straight back along the beam. The two agree when the surface is close to Lambertian, meaning it scatters evenly in all directions. They drift apart if the surface has gloss or any retroreflective behaviour, and ASTM E1331 itself does not recommend hemispherical geometry for retroreflective materials when high accuracy is needed.
So check that the geometry is written on the report. If your test uses tilted targets, ask the supplier what angular data they have.
4. The reference standard and traceability are named
Reflectance is measured by comparison with a reference white. The report should name that reference and say who calibrated it.
NIST defines metrological traceability as a result that can be related to a reference “through a documented unbroken chain of calibrations, each contributing to the measurement uncertainty”. NIST adds that the provider of the result is responsible for supporting the claim. The word “traceable” with no named reference behind it is not enough.
In the sample, the reference white was calibrated by the National Institute of Metrology, China (NIM), and the method documents are listed by number.
5. Uniformity is measured, and the positions are shown
One reading at the centre says nothing about the corners. A lidar test uses points spread across the panel, as described in our guide to LiDAR target size, so the report should give readings at several positions and show where they are.
The sample uses nine positions in a 3 × 3 grid. It reports the lowest and the highest position against the mean of all nine.
| Item | Serial no. 22070 | Serial no. 22071 |
|---|---|---|
| Mean of 9 positions | 53.26% | 53.27% |
| Lowest position | 53.25% | 53.12% |
| Highest position | 53.27% | 53.38% |
| Deviation from the mean | −0.01 / +0.01 | −0.15 / +0.11 |
| Stated uniformity tolerance | Within ±1.5 | Within ±1.5 |
Nine points on a small target sit a few centimetres apart. On a 1.2 m panel they are much further apart, so for large targets ask for the grid layout before you order.
6. The tolerance is stated in units you can check
Tolerances get written in two ways. “±2%” can mean two reflectance points, so a 10% target may sit anywhere from 8% to 12%. It can also mean two percent of the value, which is 9.8% to 10.2%. On a 10% target the two readings differ by a factor of ten, and by more on darker targets.
The report should make clear which one applies and show the measured deviation next to the limit. In the sample, deviations are given in reflectance points: a 53.12% position against a 53.27% mean is listed as −0.15.
7. You know whether it is a calibration certificate or a test report
These are different documents. A calibration certificate from an ISO/IEC 17025 accredited laboratory reports a measurement uncertainty and states how the results are traceable, as A2LA’s guidance on certificates describes. A manufacturer’s test report shows the measured values and a pass or fail against the product tolerance. It may not state an uncertainty.
Both are useful. NIST makes the point that traceability alone does not make a result fit for purpose: the uncertainty has to be small enough for the measurement you are making. If your test plan has an accuracy budget, ask the supplier for the measurement uncertainty.
8. The date, conditions and handling notes are there
Coatings age and surfaces pick up dirt. A report should carry the test date and the ambient conditions (25 °C and 40% RH in the sample), and it should tell you how to handle and clean the surface. Set a re-measurement interval for your lab and count it from the report date.
| Check | Good sign | Warning sign |
|---|---|---|
| 1. Serial number | Same number on the report and the panel label | “Typical” data with no serial number |
| 2. Wavelength | Range includes your laser; interval stated | One number with no wavelength; visible-only data for an NIR target |
| 3. Geometry | Stated, for example 8° hemispherical | Not stated |
| 4. Traceability | Reference standard and calibrating institute named | “Traceable” with nothing behind it |
| 5. Uniformity | Several positions, with a grid diagram | A single centre reading |
| 6. Tolerance | Units clear; measured value beside the limit | “±x%” with no basis given |
| 7. Document type | Uncertainty stated, or given when you ask | No answer when you ask |
| 8. Date and conditions | Test date, temperature, humidity | Undated |
What to Ask the Supplier Before You Order
The right report is easier to get before the order than after delivery. Put these five points in your request for quotation:
- The reflectance value and the wavelengths it must be reported at, for example 905 nm and 1550 nm.
- One report per panel, with serial numbers.
- The number of measurement positions and the grid layout for your panel size.
- The tolerance, stated in reflectance points.
- A sample report in advance, so you can see the format before you commit.
How Calibvision Reports Reflectance Targets
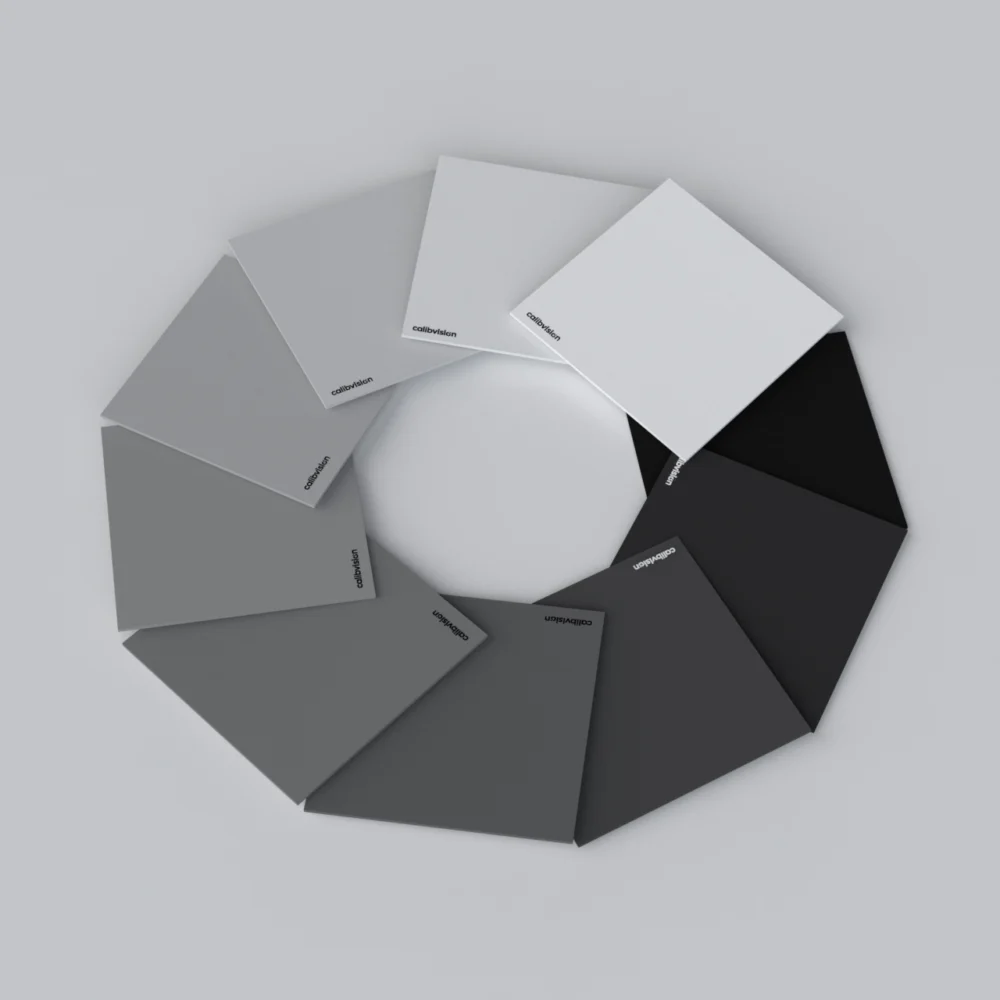
Calibvision diffuse reflectance targets ship with a report for the individual unit. The sample used in this article shows the format: nine-point spectral data at 10 nm intervals, a uniformity summary, the reference standard and a conformance statement.
The sample covers 380–1000 nm on a small target. For lidar panels, reports are issued at the wavelengths you specify, including 905 nm and 1550 nm. If you would like to see a report for your wavelength and reflectance level before ordering, contact us and we will send a matching sample.