USAF 1951 Chart PDF & Printable Targets: What They Can (and Can’t) Do
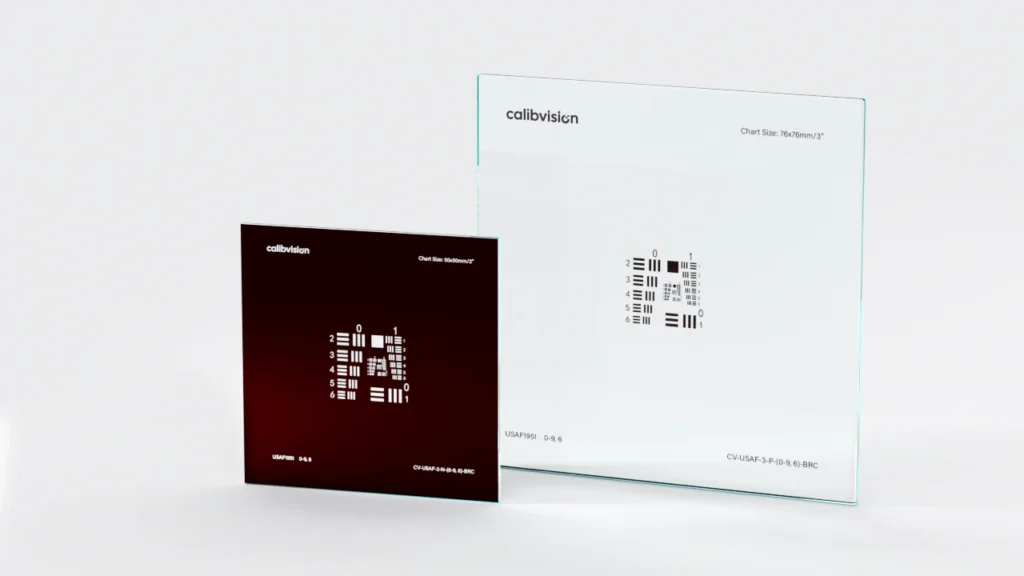
Yes, you can download and print a USAF 1951 chart PDF—but a printed target maxes out around Group 4–5 (16–32 lp/mm) with soft edges. Here’s when a printable chart works, and when you need chrome on glass to measure real resolution.
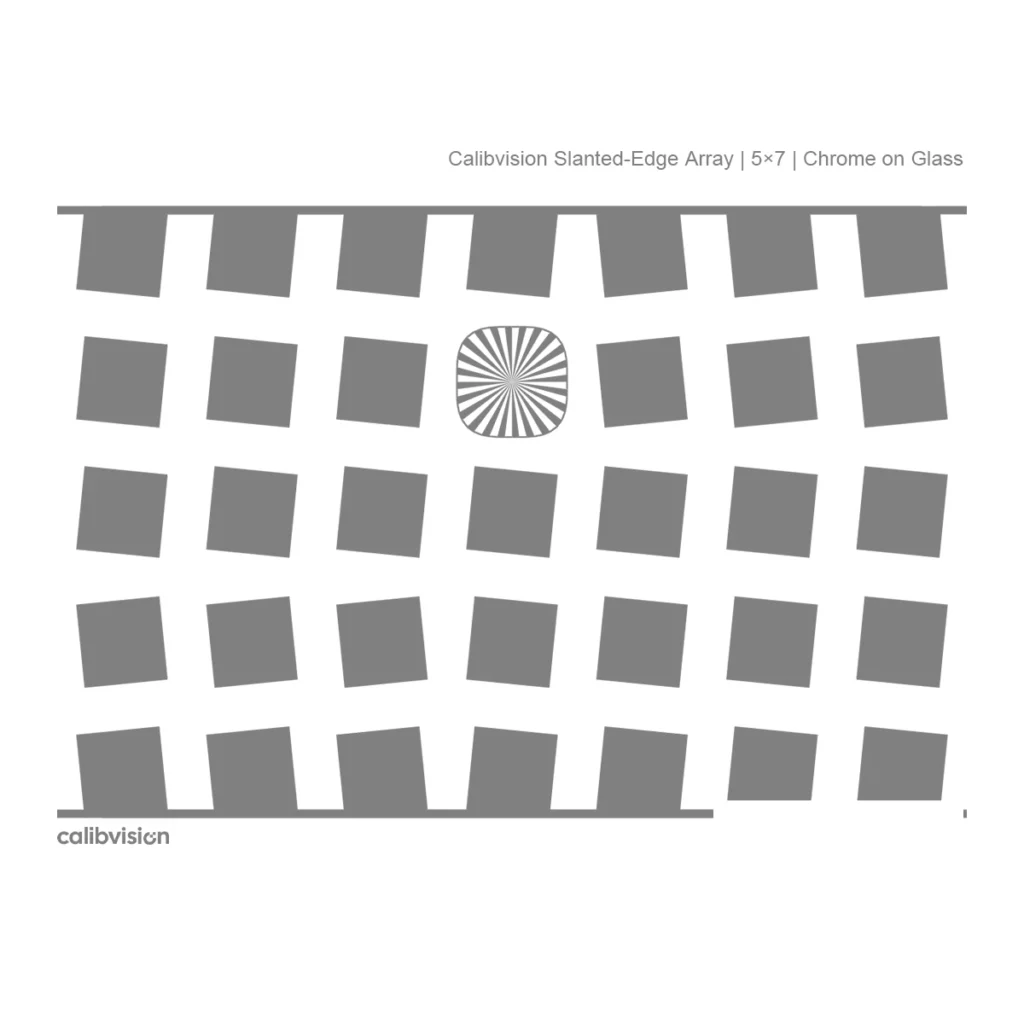
SFRreg: Why Wide-FOV and Ultra-Wide Systems Use Multiple Registration Targets Instead of One Large Chart
A single flat chart can’t be the right size, distance, and focus across a wide field of view — corners end up defocused and foreshortened. This article explains why ultra-wide, fisheye, automotive, and endoscope MTF testing uses multiple SFRreg registration targets instead: each is placed and angled for its field position, covering center and corners (plus sagittal/tangential MTF and lateral CA) in a single capture.
Optical Density vs Contrast Ratio: What 10:1 and 4:1 Really Mean
Optical density and contrast ratio describe the same thing, linked by one equation: contrast ratio = 10^(ΔOD). This article shows how to convert between them, why 10:1 = OD 1.0 and 4:1 ≈ OD 0.6, and why opaque chrome (OD 3 ≈ 1000:1) can never be a low-contrast target.
Why ISO 12233 Slanted-Edge MTF Requires a Low-Contrast Target (4:1 vs 10:1 vs High Contrast)
The slanted-edge method only gives a true MTF when the camera responds linearly. A high-contrast black-to-white edge clips and triggers sharpening, inflating the result. This article explains why ISO 12233’s low-contrast edge — about 4:1 — keeps the edge in the linear range, and compares 4:1, 10:1, and high-contrast targets.
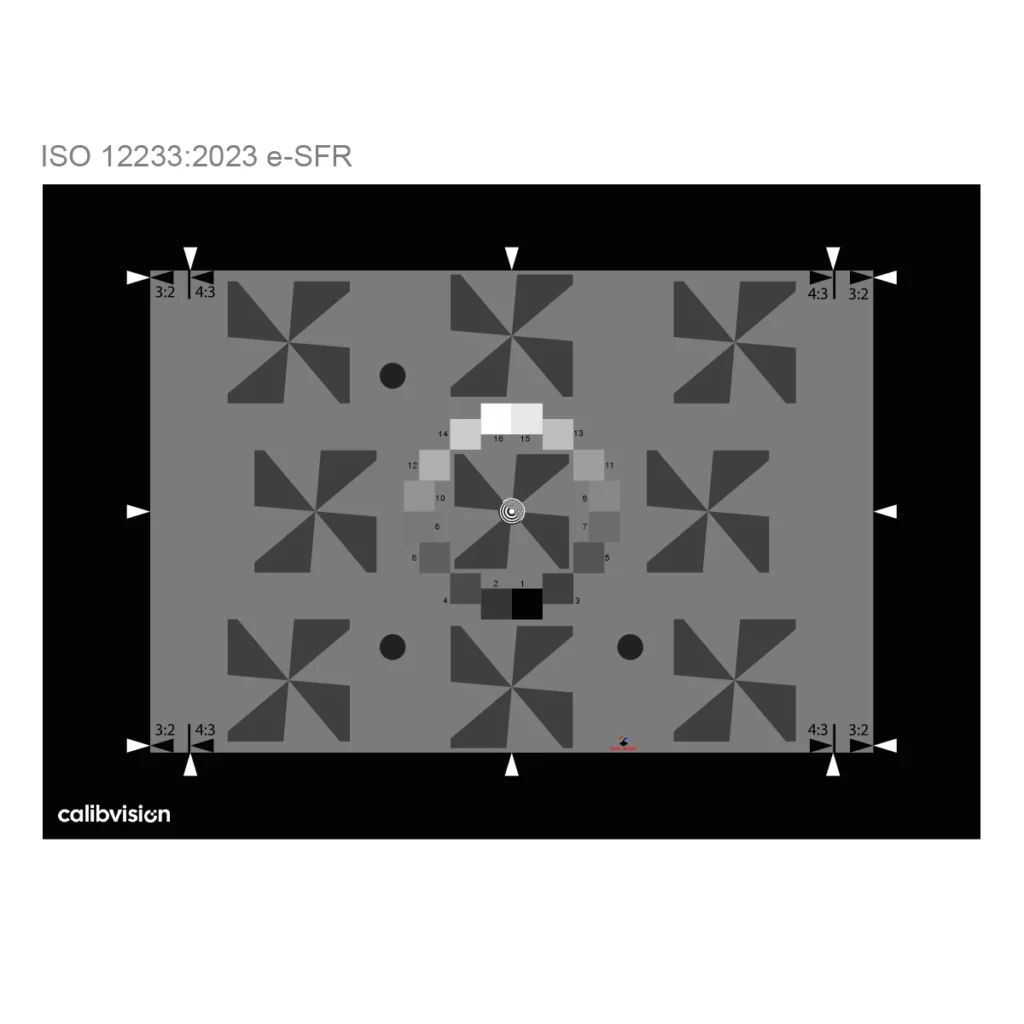
What is SFR? Spatial Frequency Response in Camera Testing
A camera does not have a sharpness. It has a curve. That single idea is the thing most people are missing when they ask “how sharp is this camera?” expecting one number back. The honest answer is that a camera reproduces coarse detail almost perfectly and fine detail progressively worse, and the rate at which […]
Standard vs Enhanced ISO 12233 Test Chart: When to Pay for the Pro Version
Most people reading this only need the Standard chart. We’ll say that up front, because the internet is full of “buy the premium version” advice written by people who profit from the upgrade, and you deserve a straighter answer than that. But “most” is not “all.” There is a specific set of measurements the Standard […]
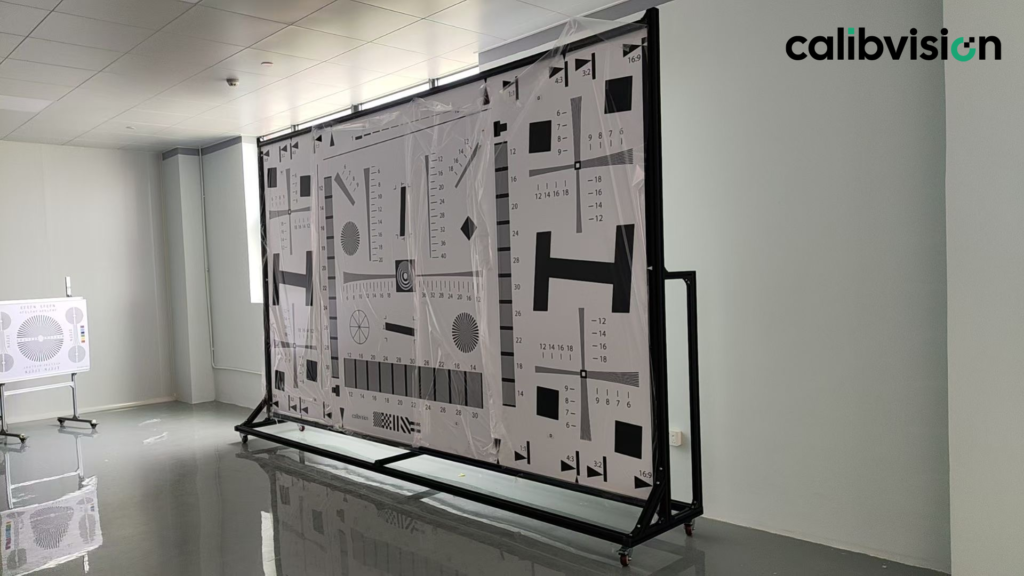
6 Common Mistakes That Ruin Your ISO 12233 Test Results
Most “wrong” ISO 12233 SFR results trace back to one of six setup mistakes — chart flatness, lighting, focus, in-camera processing, chart size, or skipping the sanity check. Here’s how each one fails, and exactly how to fix it.
Why a $50 Printed ISO 12233 Chart Is Lying About Your Lens Sharpness
You can buy a $20,000 cinema lens and a $50 chart you printed at home, and what you are actually measuring is the chart. That sounds like a sales line. It is not — it is what the math says. The ISO 12233 standard makes specific demands on feature accuracy, contrast, flatness and spectral neutrality, […]