ISO 15739 is the international standard for measuring the noise and dynamic range of digital cameras, currently in its 2023 fourth edition. Where ISO 12233 tells you how sharp a camera is, ISO 15739 tells you how clean it is — how much noise sits under the signal, how wide a range of brightness it can capture, and how it maps light to pixel values. It does this from a grayscale step chart: a set of patches of known, increasing optical density. This guide covers what the standard measures, how the chart produces those numbers, reflective versus transmissive charts, and the setup detail that quietly ruins most results.
What does ISO 15739 measure?
Four related quantities, all from the same step chart:
- SNR (signal-to-noise ratio) — the signal level divided by the noise at that level. Higher is cleaner.
- Dynamic range — the span from the brightest tone the sensor can hold before saturating down to the darkest tone still distinguishable from noise (where SNR falls to 1).
- OECF (opto-electronic conversion function) — the camera’s transfer curve from scene luminance to output pixel value. You need it to linearise the data before the noise numbers mean anything.
- Visual noise — a perceptual noise metric, weighted to how the human eye responds, formalised in the 2023 edition. It correlates with how noisy an image looks, not just its raw standard deviation.
How does the step chart produce these numbers?
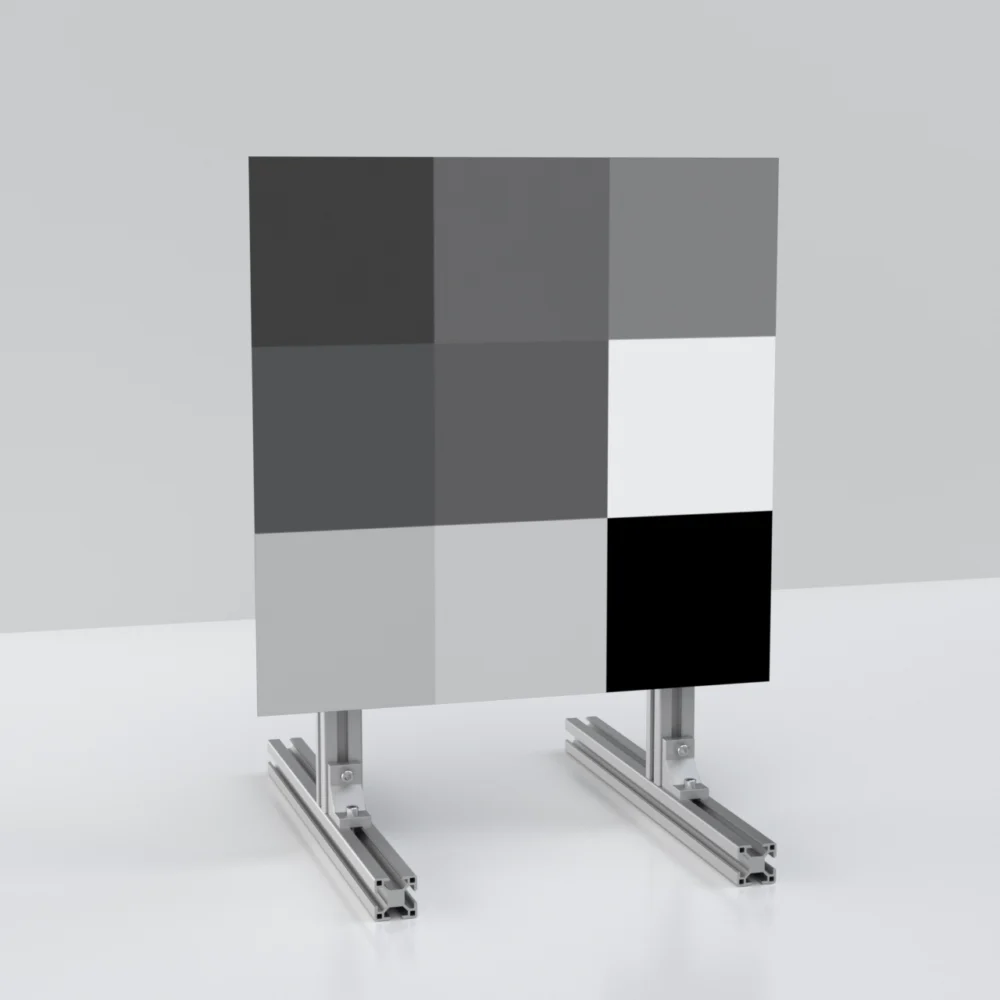
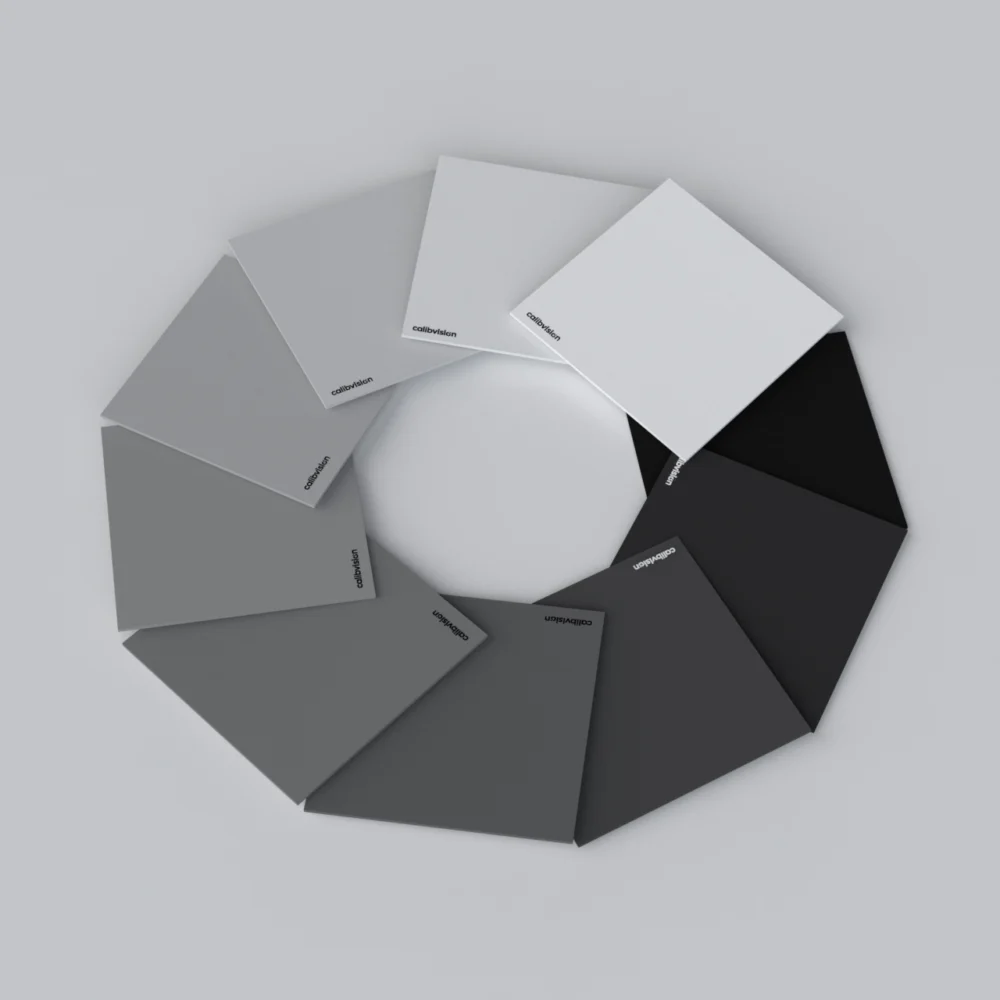
Each patch has a known optical density, so its relative luminance is known. Image the chart under uniform light, then for every patch measure two statistics of the pixels inside it:
- The mean pixel value — one point on the OECF (known luminance in, measured value out). Across all patches, the means trace the camera’s tone curve.
- The standard deviation of pixel values — the noise at that signal level (the patch is uniform, so any spread is noise).
From those, SNR at each level is the linearised signal over its standard deviation, and dynamic range is the luminance ratio between saturation and the point where SNR drops to 1. Software such as Imatest Stepchart, Multicharts and ColorTest reads all patches at once and reports the curves.
Why the OECF comes first
Most cameras do not map light to pixels linearly — they apply gamma and tone curves. If you compute noise on those non-linear values, a bright patch and a dark patch aren’t on the same scale and the SNR figures are meaningless. The OECF, built from the patch means, is what lets you linearise first and compare like with like. It is the step people skip, and it is why raw “standard deviation of the image” is not a valid noise measurement.
Reflective or transmissive?
The chart’s contrast range sets how much dynamic range you can measure — you cannot measure a range wider than the chart provides.
| Chart | Contrast | Best for |
|---|---|---|
| Reflective, matte (front-lit) | ~40:1 | SNR, OECF, visual noise on standard scenes |
| Transmissive, backlit (high-density) | up to ~10,000:1 | Full dynamic range of modern high-DR sensors |
A reflective chart is limited to the contrast a matte surface can hold — around 40:1 — which is plenty for SNR, OECF and visual noise. To characterise the full dynamic range of a modern sensor, you need a high-density transmissive chart, backlit, reaching several thousand to one. The reflective patches must be matte and diffuse so their apparent brightness doesn’t change with angle — the same Lambertian behaviour that makes diffuse reflectance standards reliable. Any gloss or glare adds a false highlight that the software reads as signal.
The setup that ruins ISO 15739 results
Noise measurement is unforgiving because anything non-uniform looks like noise. In order of how often they cause trouble:
- Uneven illumination. A lighting gradient across a patch adds to its standard deviation and inflates the noise reading. Uniform, even lighting is the single most important condition — more than the camera under test.
- Glare and reflections. Light off a semi-gloss surface or the chart frame creates local bright spots read as signal. Keep the surface matte and light at 45°.
- Patches too small. Noise is a statistic — each patch needs enough pixels for a stable standard deviation. Fill the frame so patches are large.
- Wrong exposure. Clip the bright patches or crush the dark ones and you lose the ends of the OECF, truncating the dynamic range you can report.
ISO 15739 and ISO 12233: the two halves of image quality
They answer different questions and use different charts. ISO 12233 measures resolution and sharpness from slanted edges (SFR); ISO 15739 measures noise and dynamic range from grey patches (SNR, OECF). A sharp camera can still be noisy, and a clean camera can still be soft, so a full image-quality workup uses both. For the resolution side, see the ISO 12233 chart comparison.
The ISO 15739 chart specifications
CalibVision’s ISO 15739:2023 chart is a 15-patch grayscale step chart — 12 outer patches stepping from 0.10 to 2.00 optical density, plus 3 centre patches (0.77–1.05) — at a 40:1 contrast ratio on a matte diffuse surface. It is offered in a 16:9 aspect ratio in five active-area sizes from 100×177.8 mm to 800×1422.2 mm, with magnification options of 0.5× to 4.0×, and is compatible with Imatest Stepchart, Multicharts and ColorTest.
| Specification | Value |
|---|---|
| Standard | ISO 15739:2023 (4th edition) |
| Patches | 15 (12 outer 0.10–2.00 D + 3 centre) |
| Contrast (reflective) | 40:1, matte diffuse |
| Sizes (16:9) | 100×177.8 to 800×1422.2 mm |
| Magnification | 0.5× · 1.0× · 1.5× · 2.0× · 4.0× |
| Software | Imatest Stepchart / Multicharts, ColorTest |
A high-density transmissive version for full dynamic-range work is available on request. Every chart ships with a serial-numbered inspection report documenting the measured patch densities; measurements are NIST/NIM-traceable, with product-level traceability under CNAS L0579 and ILAC-MRA, and third-party CNAS/ILAC calibration on request.
How do I order the right ISO 15739 chart?
Tell us your sensor and the range you need to characterise — SNR and OECF on a reflective chart, or full dynamic range on a high-density transmissive one — plus your working distance and software. Standard charts ship in 4–6 working days with a documented, serial-numbered inspection report.