If you buy calibration targets, your supplier’s inspection report is the only thing that lets you trust a part you can’t easily measure yourself. But most reports give you raw deviation numbers that conflate two unrelated things — how accurately the part was actually made, and how the operator placed it on the measurement stage. This article explains the four numbers that should be on every report, why Kabsch rigid-body alignment is non-negotiable, and walks through a real CalibVision delivery to an FDA-cleared dental-imaging customer as a worked example.
TLDR
- A trustworthy calibration-target inspection report carries four numbers: pass rate, maximum radial residual, standard deviation, and 95th percentile — all computed after Kabsch rigid-body alignment.
- Translation-only alignment is the classic supplier mistake. It inflates apparent error by 1–3 μm and can convert a clean part into a marginal-pass part on paper.
- A part that is “100 % inside ±2 μm with σ(Δr) = 0.37 μm” is qualitatively different from one that is “97 % inside ±2 μm with σ(Δr) = 1.5 μm” — and you should pay for the difference.
When a Mitutoyo or SmartScope-class vision measurement system reports the position of a checker corner, what it gives you is a coordinate in the measurement system’s frame. That frame is fixed to the granite, not to your part. So the reported coordinate has three components stacked on top of each other:
- The corner’s nominal design position
- The fabrication error you are trying to measure
- The mounting offset and small rotation introduced when the part was placed on the measurement stage
Component (3) is irrelevant. Once your part leaves the supplier’s metrology lab, nobody cares how its coordinate frame happened to be oriented during inspection. What matters for downstream camera-calibration use is component (2) — the actual fabrication error.
The standard fix is rigid-body alignment. You compute the unique translation and rotation that map the measured grid onto the nominal grid as closely as possible, apply the inverse, and look at what is left over. Whatever is left is the part’s true fabrication error.
A supplier report that shows residuals against an absolute reference — or worse, with translation-only alignment that leaves a small mounting rotation in place — is reporting inflated numbers. We have seen mounting rotations of 5–15 millidegrees inflate the apparent maximum residual by 1–3 μm depending on the size of the active pattern. On a ±2 μm spec, that is the difference between PASS and REJECT for parts that are functionally identical.
The four numbers that matter
Pass rate
Pass rate is the percentage of measured features whose post-alignment residual lands inside the customer specification window. For a checkerboard target with a ±2 μm position-accuracy spec, the pass rate equals the fraction of saddle-point corners whose (ΔX, ΔY) sit inside the ±2 μm tolerance box.
This is the headline number on the report; everything else explains it. A pass rate below 100 % at outgoing inspection raises an immediate question: were the failing corners reworkable measurement artifacts (specular reflection, dust on the corner, illumination issue)? Or were they real fabrication errors that the supplier shipped anyway? The report should disclose which.
Maximum radial residual
|Δr|max is the largest single deviation in the dataset, expressed as a radial distance from the corner’s nominal position.
It tells you the worst-case behaviour of your part. The math is direct: if your spec is ±2 μm and your maximum is 1.6 μm, you have a 25 % margin. If your maximum is 1.95 μm, you have effectively no margin and you should expect spec-edge surprises in production.
A maximum reported on a 144-corner sample also tells you something about the population maximum — but not everything. If the part has 2,500 corners and only 144 were measured, the population maximum will likely exceed the sample maximum. Ask for the sampling protocol whenever the maximum is close to the spec.
Standard deviation σ(Δr)
σ(Δr) is the standard deviation of the radial residual across all sampled features. It tells you the shape of the distribution rather than its tail.
A part with σ(Δr) = 0.37 μm and a ±2 μm spec is sitting comfortably 5σ inside spec — process noise alone will not push it out. A part with σ(Δr) = 1.5 μm and the same spec might pass the pass-rate test today, but it is one bad lot away from failing. Two parts with identical pass rates can have very different σ, and σ tells you which one will reproduce.
95th percentile P95(|Δr|)
P95(|Δr|) is the radial residual below which 95 % of measured features fall.
This is what most of your downstream system will actually see in normal use, since most camera-calibration optimisation routines weight the bulk of the data, not the tails. If P95 is comfortably below the spec, your real-world calibration performance will be better than the spec suggests.
P95 is also a clean way to compare two parts that happen to have identical worst-case maxima but different overall distributions. The one with the lower P95 is the better part.
Kabsch rigid-body alignment in plain language
The right way to align a measured grid to its nominal grid is the Kabsch algorithm, originally published by Wolfgang Kabsch in 1976 for aligning protein structures. It has been the metrology and computer-vision standard ever since, used wherever you need to align two corresponding point sets.
In plain language, Kabsch finds the unique combination of translation and rotation that, when applied to your measured grid, makes it fit the nominal grid as tightly as possible. Whatever residual is left over after the alignment is the part’s true fabrication error.
What rigid-body alignment removes:
- Translation — wherever the part was placed on the measurement stage.
- Rotation — however the part happened to be oriented relative to the stage axes.
What rigid-body alignment does not remove (and should not):
- Local position errors at individual corners.
- Pitch errors — real differences between adjacent-corner spacings.
- Pattern distortion — barrel-, pincushion-, or trapezoidal-shape deformation of the grid.
These are the things you are paying accuracy for. A correctly aligned report leaves them visible; an incorrectly aligned report buries them in mounting noise.
A note on extensions: for grids that span large distances (≥ 200 mm) or for substrates with appreciable thermal expansion mismatch against the measurement-system reference, the standard practice can be extended to a similarity transform — translation, rotation, and a single uniform scale factor — to absorb thermal expansion and measurement-system scale offsets. The case study below did not need this; on a 25 × 25 mm pattern, scale uncertainty was below the measurement noise floor.
Worked example: a 50 × 50 glossy-ceramic checkerboard, ±2 μm at every corner
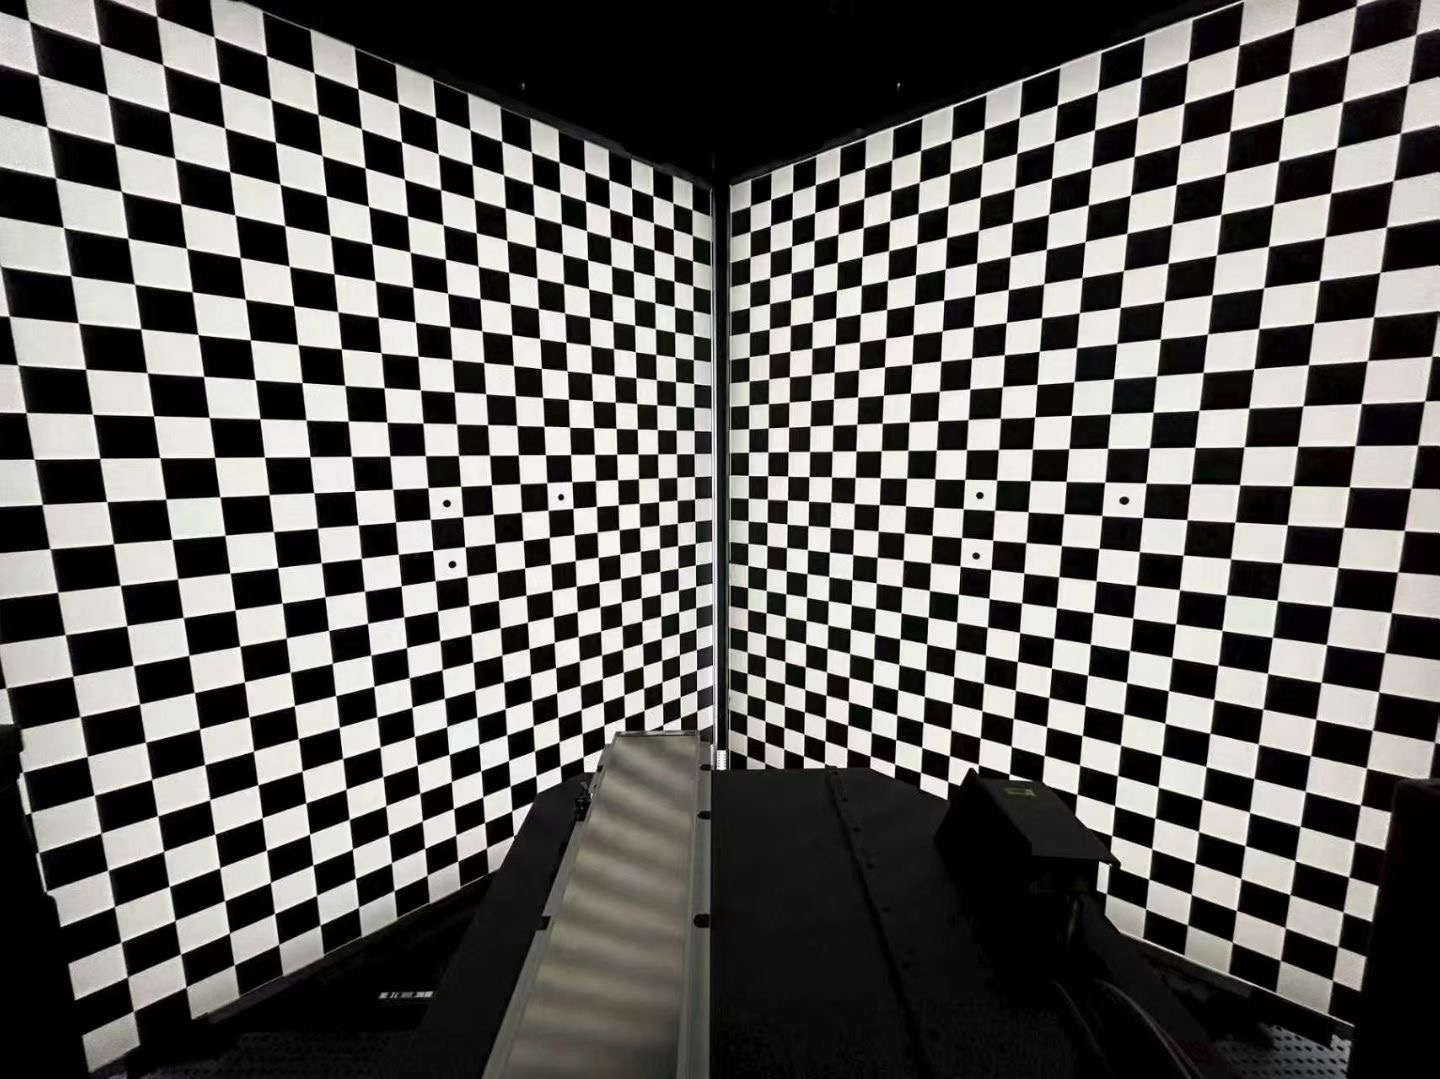
Earlier this year, CalibVision delivered a 27 × 27 × 1 mm glossy-ceramic checkerboard target — 50 × 50 cells at 0.5 mm pitch, ±2 μm position accuracy at every saddle-point corner — to an Asia-based digital-dentistry OEM. The customer’s flagship product is a handheld 3D intraoral scanner cleared by both the U.S. FDA and the European CE MDR. The scanner builds 3D models of patient dentition for downstream crown, bridge, and aligner CAD/CAM, where micron-level scan accuracy translates directly into prosthetic fit. (The customer’s name is withheld in this published article; the underlying inspection record is on file at CalibVision and available to qualified parties under NDA.)
The customer came to CalibVision after a quality escape from a previous calibration-target supplier. They had received a lot of glossy-ceramic targets in which several parts showed coating-pinhole defects, edge chipping, and surface contamination that should have been caught at outgoing inspection. They documented every defect, photographed each non-conforming feature, and assembled the evidence into a “do-not-repeat” brief that was given to CalibVision as a precondition for the new order.
CalibVision’s response:
- Every category in the customer’s brief became an explicit named line item in the inspection plan, with a per-part PASS/FAIL verdict.
- Visual inspection covered the full 2,500-cell pattern under microscope on every part.
- Dimensional inspection sampled 144 saddle-point corners per part on a 1.5 mm step grid (every 3rd corner) using a Mitutoyo Vision Measuring System.
What the data looked like
After Kabsch rigid-body alignment, the per-corner residual heatmap looked like this:
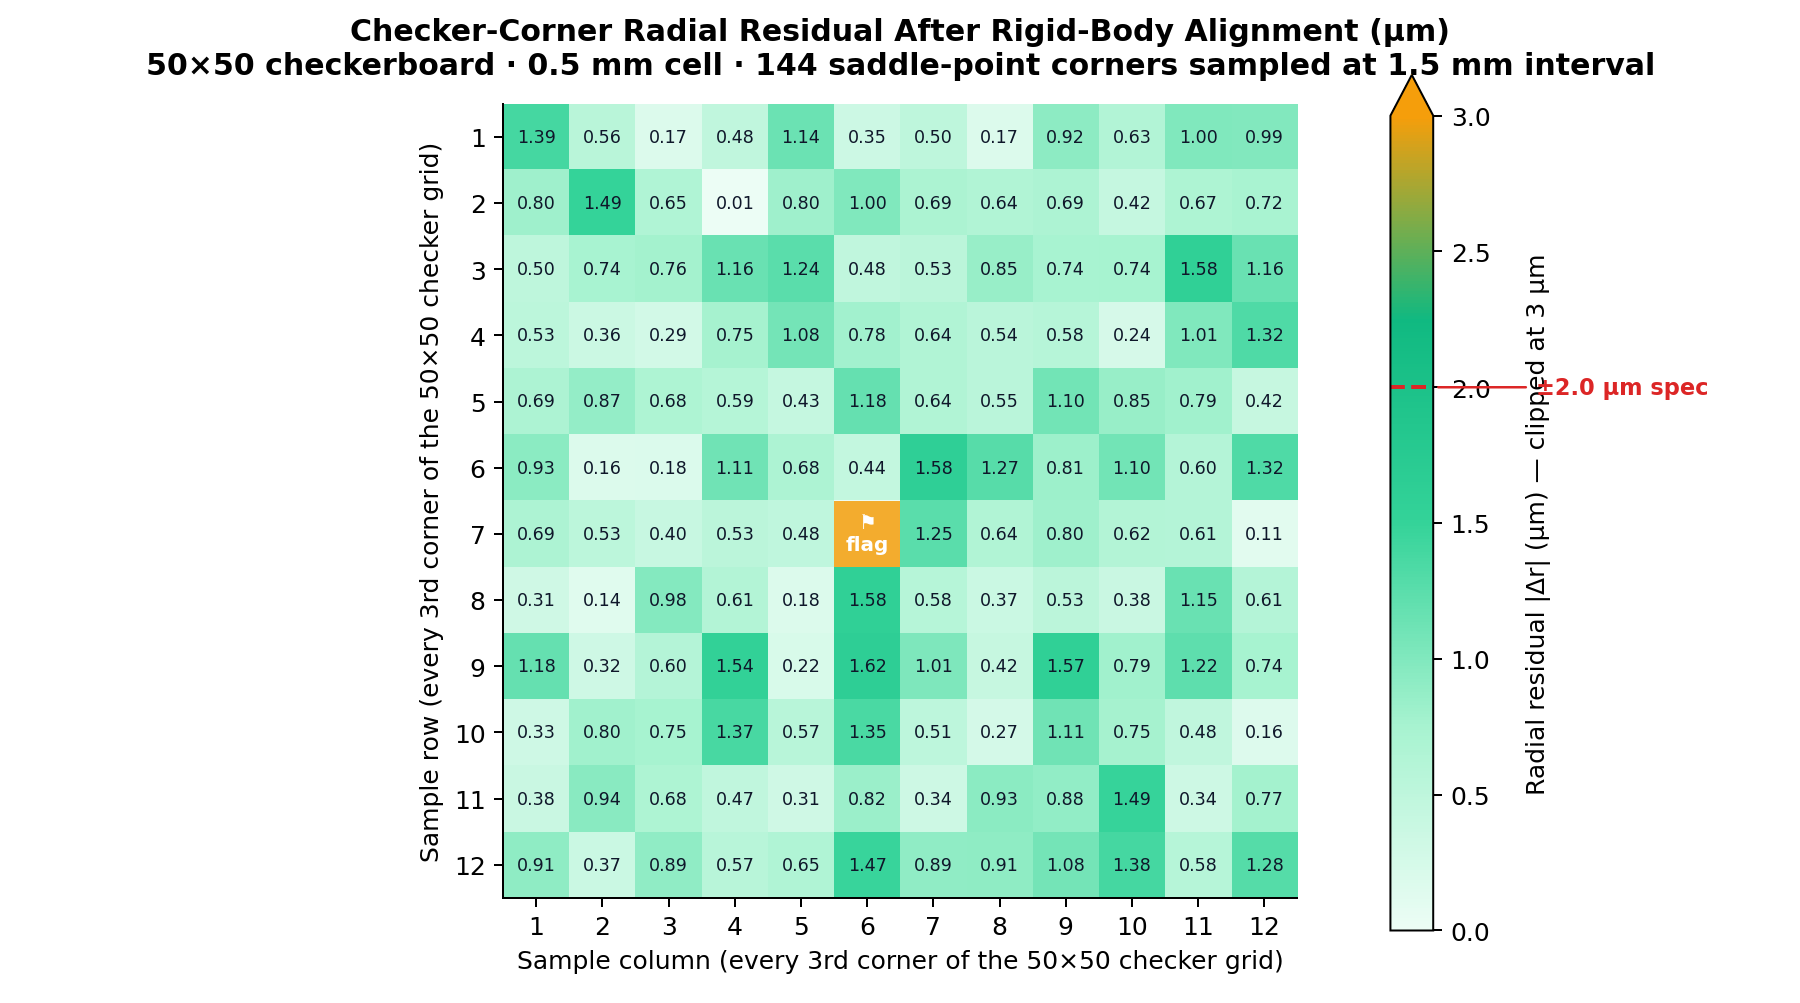
1 corner at sample [7,6] auto-flagged by Mitutoyo (raw X=-42.5 μm).Specular reflection on glossy-ceramic surface; re-measurement returned in-spec.
Radial residual at each of the 144 sampled saddle-point corners after Kabsch rigid-body alignment, in micrometres.
The mounting rotation that Kabsch removed was −7.5 millidegrees — about 130 microradians. That is roughly the rotation introduced by setting a part down by hand instead of with a kinematic fixture, and it is exactly the kind of nuisance rotation rigid-body alignment is meant to remove.
The (ΔX, ΔY) scatter against the ±2 μm tolerance window:
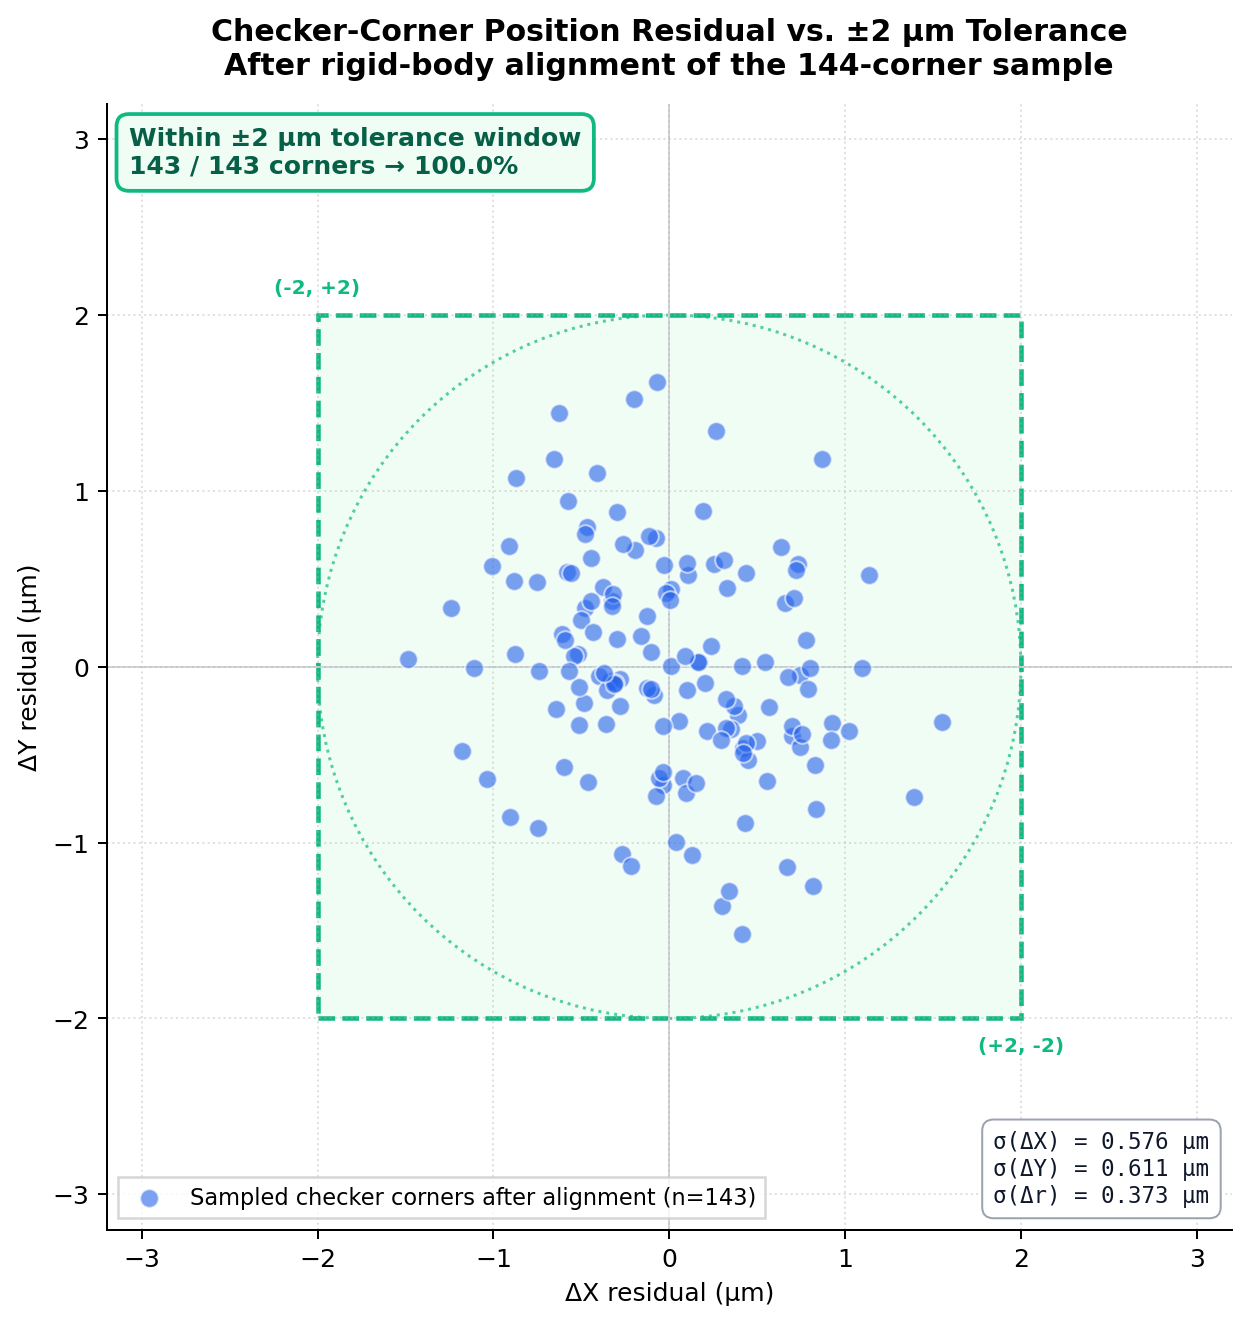
tolerance window.
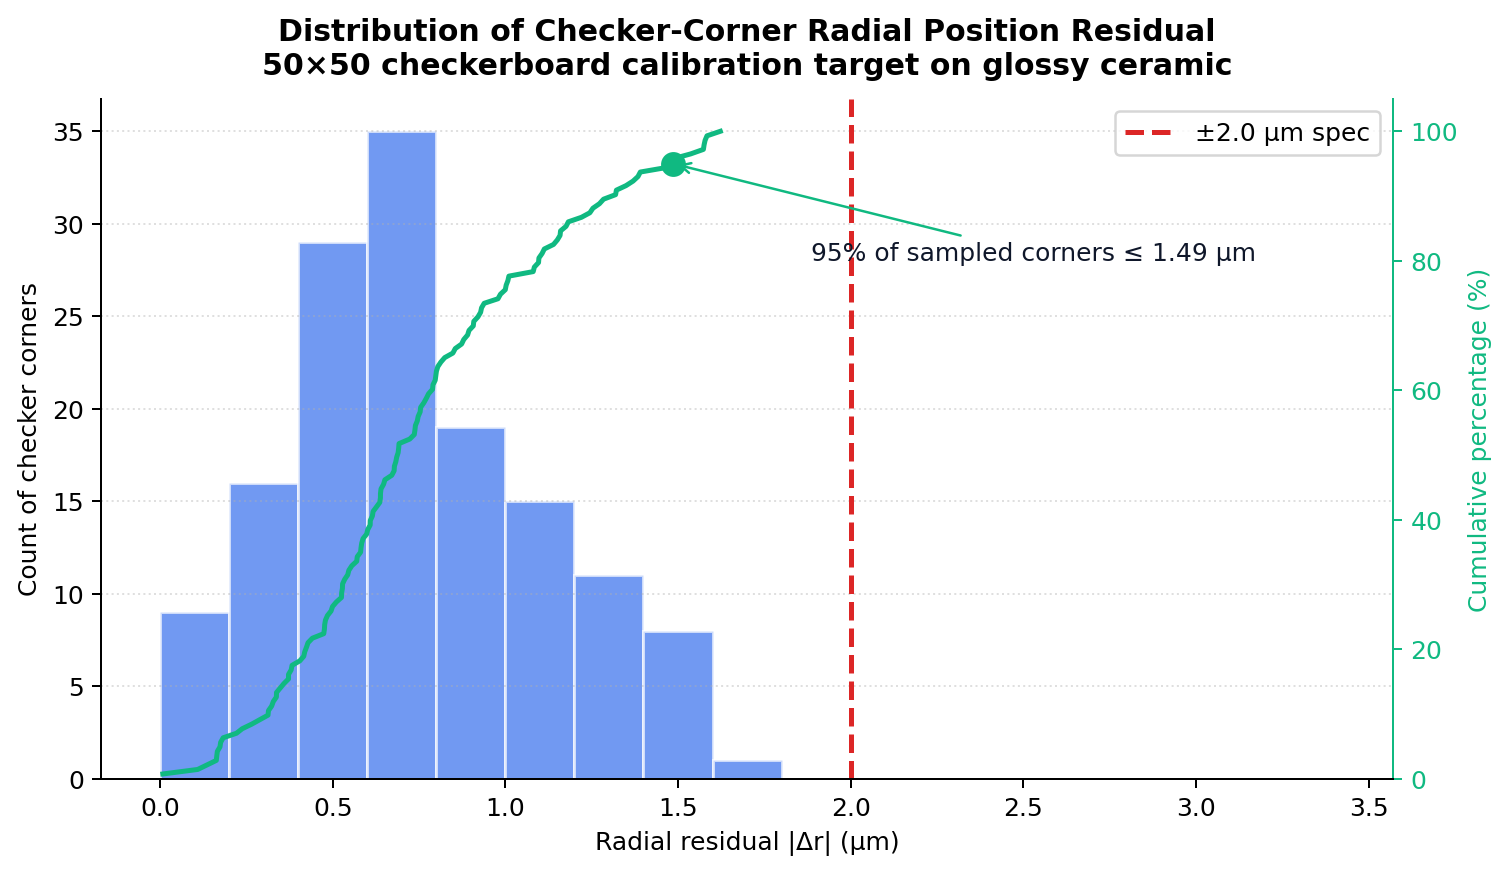
And the radial-residual distribution:
The four numbers
| Metric | Result | Spec |
| Pass rate within ±2 μm box | 100 % (143/143) | — |
| Maximum radial residual |Δr|max | 1.62 μm | ≤ 2 μm |
| Standard deviation σ(Δr) | 0.37 μm | — |
| 95th percentile P95(|Δr|) | 1.49 μm | — |
These numbers say: the part is sitting more than 5σ inside spec. Process noise alone will not push it out. Even at the worst-observed corner, the part has 0.38 μm of margin against the ±2 μm spec.
The flagged corner
On the first measurement pass, one corner — at sample [row 7, column 6] — was auto-flagged by the Mitutoyo system with an X-deviation of −42.5 μm. Its eight nearest neighbours all read in spec. A single corner showing 40× the spec while everything around it passes is the textbook signature of a measurement artifact, not a part defect.
Investigation found the cause: a specular reflection on the glossy-ceramic surface had biased the corner-detection algorithm at that one location. The same corner, re-measured under modified illumination geometry, returned +1.2 μm — within spec. The part was released.
The lesson is not that no measurement is ever odd. It is that 100 % inspection has to do something when a measurement is odd: catch it, flag it, investigate, document the resolution. “General visual inspection” does not do that. A named, explicit checklist with a verdict per item does.
The lot was accepted by the customer’s incoming-quality team without rework.
Five red flags when reading a supplier’s inspection report
Five things to look for when qualifying a calibration-target supplier:
- Is residual reported after rigid-body alignment, or against an absolute reference? The right answer is “after Kabsch rigid-body alignment”. If the report does not say, ask. If it says “translation only” or “best-fit translation”, apply mental skepticism — the residuals are inflated by however much rotation slipped through.
- Is the alignment method named explicitly? A report that says “post-aligned residual” without specifying the method has a non-trivial chance of meaning translation-only. A report that names “Kabsch”, “rigid-body fit”, or “least-squares fit with translation and rotation” is showing you the right thing.
- Are all four key numbers reported? Pass rate alone is a marketing number. Max alone misses distribution shape. σ alone misses the tail. P95 alone misses the headline. You need all four to evaluate the part.
- Is the sampling protocol disclosed? “144 of 2,500 corners measured at every 3rd index” gives you a sampling protocol you can reason about. “All corners measured” is rare for fine-pitch grids and may be implausibly fast. Ask which corners were measured and why.
- Are flagged-and-re-measured points separately disclosed? Any 100 %-inspection process flags a small number of measurements. A report that admits “1 corner flagged, re-measured in spec” is more credible than one that reports a clean 144/144 with no anomalies. The first acknowledges the messiness of real measurement; the second may have quietly suppressed it.
Frequently asked questions
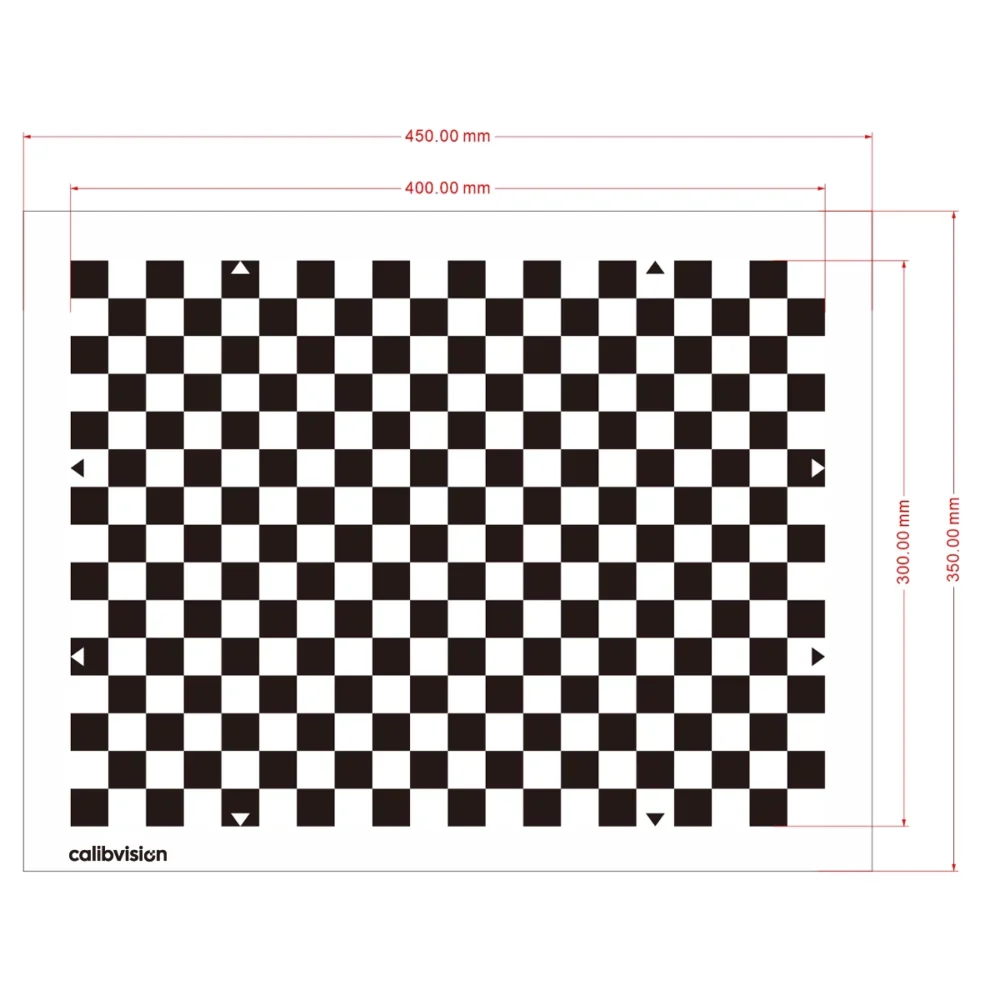
What is a checkerboard calibration target?
A checkerboard calibration target is a flat reference object with a grid of alternating black and white squares, used to calibrate the geometric parameters of cameras and 3D vision systems. The intersections between squares — saddle-point corners — provide sub-pixel-localizable features for camera-intrinsic and pose calibration.
How accurate is a checkerboard calibration target?
Production checkerboard calibration targets are typically specified at ±1 to ±15 μm position accuracy at every corner, depending on substrate, manufacturing process, and pitch. Photolithography on chrome-coated glass or ceramic delivers the tightest accuracy (±1 to ±2 μm); ink-printed or laser-cut targets are looser (±15 to ±100 μm).
What is Kabsch alignment?
Kabsch alignment is an algorithm that finds the optimal translation and rotation to map one set of points onto another, minimising the sum of squared distances. In calibration-target metrology it removes the mounting offset and rotation introduced by the measurement-stage setup, leaving only the part’s true fabrication error in the residuals.
Why use glossy ceramic for a calibration target?
Glossy ceramic is mechanically rigid, dimensionally stable across temperature, and resistant to handling damage. The trade-off is harder vision-based metrology: specular reflections from the chrome coating can confuse corner-detection algorithms, requiring controlled-illumination measurement protocols.
What is a saddle-point corner?
A saddle-point corner is the geometric intersection between four cells of a checkerboard pattern, where two black and two white cells meet diagonally. Saddle-point corner detection finds the exact sub-pixel location of this intersection by fitting a saddle-shaped surface to the local image intensity, achieving precision well below one pixel.
How is a calibration target measured?
Calibration targets are typically measured on vision-based coordinate measuring machines such as the Mitutoyo Vision Measuring System or the OGP SmartScope. The system images each calibration feature, applies sub-pixel detection algorithms to locate the feature centre, and reports the (X, Y) coordinate in the machine’s reference frame. Position accuracy of the measurement system itself is approximately ±0.5 μm or better for top-tier instruments.
What is the difference between rigid-body alignment and translation-only alignment?
Rigid-body alignment removes both the translation and the rotation introduced when the part is placed on the measurement stage; translation-only alignment removes the translation but leaves the rotation in place. On a fine-pitch grid, even a small mounting rotation (5–15 millidegrees) can inflate the apparent maximum residual by 1–3 μm, which can convert a passing part into a failing one on paper.
About CalibVision
CalibVision LLC manufactures precision calibration targets for machine vision, autonomous driving, robotics, medical imaging, and optical inspection industries. We produce on glass, ceramic, aluminium, film, and carbon-fibre substrates, with photolithographic chrome and ink patterning. Standard product lines include checkerboard, OpenCV checkerboard, Halcon circle-dot, AprilGrid, ChArUco, USAF 1951, ISO 12233, SFR Plus, and diffuse reflectance targets — alongside fully-custom designs. Every product ships with verified dimensional measurement data; CNAS / ILAC-MRA-traceable third-party calibration is available on request.
If you have a calibration-target requirement that needs the inspection rigor described in this article — including named-checklist visual inspection, Kabsch-aligned dimensional reporting, and per-part traceability — write to sales@calibvision.com or visit calibvision.com.
Engineering enquiries: sales@calibvision.com | Quality questions: © 2026 CalibVision LLC. This article may be quoted with attribution and a link back to the original publication.