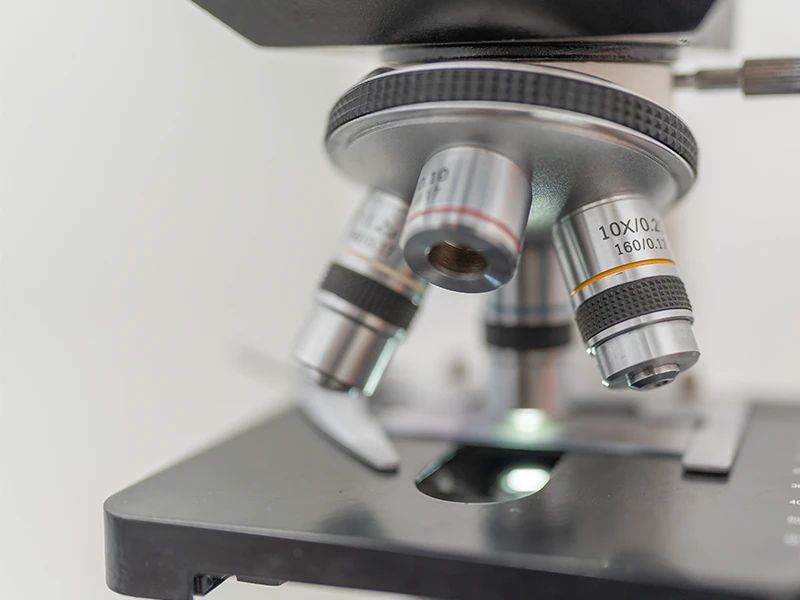
Every microscope user eventually wonders: Is my objective still performing to spec? Maybe images look softer than they used to. Maybe a critical experiment requires absolute sharpness. Maybe you just inherited a shared scope and don’t know its history.
Whether you’re a research biologist, a microscopy core facility manager, an industrial QC engineer, or a service technician, you need a fast, repeatable way to answer that question. This guide walks through the complete procedure used by professional microscope labs to validate objective lens quality — using nothing more than a USAF 1951 test slide, your existing microscope, and 10 minutes of your time.
Why Microscope Objective Quality Matters
A microscope objective is the most critical optical component in your imaging system. The condenser, eyepieces, even the camera, can be mediocre — but if the objective is sharp, your image will be sharp. Conversely, a $20,000 microscope body with a degraded objective produces $200 images.
Objectives degrade for many reasons:
- Coating damage from repeated cleaning with the wrong solvents (acetone is a frequent offender)
- Mechanical shock from drops, stage crashes, or rough storage
- Contamination — immersion oil bleeding into dry objectives, fingerprints, dust on internal surfaces
- Thermal cycling in non-climate-controlled labs
- Coverslip mismatch — using non-standard 0.17 mm coverslips with high-NA corrected objectives
- Immersion medium degradation — dried, oxidized, or contaminated oil
- Element decentering from age or handling
A systematic QC procedure catches these problems before they ruin experiments. For core facilities, regular QC is also required under ISO 17025, GLP, GMP, and similar quality systems.
What Does “Objective Quality” Actually Mean?
Objective performance is multidimensional. The six most important parameters are:
| Dimension | What it means | Primary measurement |
| Resolution | Smallest two points distinguishable | USAF 1951 chart |
| Contrast (MTF) | How sharply edges are rendered across spatial frequencies | Slanted edge or USAF |
| Chromatic aberration | Color fringing on high-contrast edges | USAF with R/G/B illumination |
| Field curvature | Sharpness at edges vs. center | USAF readings at multiple field positions |
| Field flatness | Even illumination across field | Diffuse white target |
| Working distance | Specimen-to-objective distance | Mechanical measurement |
This guide focuses on resolution because it’s the single most actionable test — easy to measure, comparable to theoretical limits, and directly tied to experimental utility. The other dimensions are addressed briefly at the end.
Quick Answer: The 10-Minute Resolution Test
For most users, here’s the fastest reliable procedure:
- Place a 1″ USAF 1951 test slide on the microscope stage
- Set up Köhler illumination (5 minutes — full procedure below)
- Bring the highest-resolution group of the chart into the field of view
- Find the smallest element where you can clearly count three distinct bars in both horizontal and vertical orientations
- Calculate the resolution: lp/mm = 2^(Group + (Element − 1) / 6)
- Compare to the objective’s theoretical maximum (NA-based, table below)
Interpreting the result:
- Within 1 element of theoretical → objective is performing to spec ✓
- 2–3 elements below → likely a fixable issue (cleaning, alignment, coverslip mismatch)
- 4+ elements below → objective needs service, recoating, or replacement
Computing Your Objective’s Theoretical Maximum (NA → Expected USAF Reading)
Every microscope objective has a physical resolution limit set by its numerical aperture (NA). The Rayleigh-criterion resolution at green light (λ = 550 nm) is:
Resolution (μm) = 0.61 × λ / NA ≈ 0.336 / NA
Converting to line pairs per millimeter (the USAF unit):
Theoretical max (lp/mm) ≈ 1488 × NA
This table shows the expected maximum USAF reading for common microscope objectives:
| Objective | Typical NA | Theoretical resolution | Theoretical lp/mm | Closest USAF element |
| 2× plan | 0.06 | 5.60 μm | 89 lp/mm | Group 6 Element 4 (90.5) |
| 4× plan | 0.1 | 3.36 μm | 149 lp/mm | Group 7 Element 2 (143.7) |
| 4× plan apo | 0.16 | 2.10 μm | 238 lp/mm | Group 7 Element 5 (203.2) – G8 E1 (256) |
| 10× plan | 0.25 | 1.34 μm | 372 lp/mm | Group 8 Element 4 (362) |
| 10× plan apo | 0.4 | 0.84 μm | 595 lp/mm | Group 9 Element 2 (574.7) |
| 20× plan | 0.4 | 0.84 μm | 595 lp/mm | Group 9 Element 2 (574.7) |
| 20× plan apo | 0.75 | 0.45 μm | 1,116 lp/mm | Exceeds chart (max 912.30) |
| 40× plan | 0.65 | 0.52 μm | 967 lp/mm | Group 9 Element 6 (912.30) ✓ chart max |
| 40× plan apo | 0.95 | 0.35 μm | 1,414 lp/mm | Exceeds chart |
| 60× water | 1.2 | 0.28 μm | 1,786 lp/mm | Exceeds chart |
| 100× oil | 1.3 | 0.26 μm | 1,934 lp/mm | Exceeds chart |
| 100× oil apo | 1.4 | 0.24 μm | 2,083 lp/mm | Exceeds chart |
Key Insight: When You Exceed the Chart
For objectives with NA ≥ 0.75 — high-NA dry, water immersion, oil immersion — the theoretical maximum exceeds USAF 1951’s 912.30 lp/mm ceiling. At these NAs, “passing the test” simply means resolving Group 9 Element 6 cleanly.
To distinguish between, say, an NA 1.0 dry objective and an NA 1.4 oil immersion objective, you need either:
- A custom higher-resolution chart (line widths below 0.55 μm)
- A different methodology such as point-spread function measurement using sub-resolution beads
- Direct MTF measurement using slanted-edge methods
For most practical microscope work — teaching scopes, routine biology objectives, industrial inspection — USAF 1951 is the right tool and gives you a direct, unambiguous pass/fail.
Setting Up Köhler Illumination (Critical for Accurate Testing)
This is the single most important step. Many “the objective is bad” complaints actually trace back to misconfigured Köhler illumination, which artificially limits effective NA and degrades the apparent resolution by 1–3 elements.
Why Köhler Matters
Without Köhler illumination, your condenser doesn’t fully fill the back aperture of the objective — meaning the effective NA is lower than the objective’s marked NA. The result: even a perfect objective will appear to underperform.
Step-by-Step Köhler Setup
- Place the test slide on the stage and bring a low-magnification objective (10×) into position
- Focus on the chart using the coarse and then fine focus knobs
- Close the field diaphragm (the iris near the light source) almost completely — you should see a small hexagonal or circular bright spot
- Adjust the condenser height until the edges of the field diaphragm appear sharp in the focused image. (Use the condenser focus knob, not the stage knob)
- Center the field diaphragm using the condenser centering screws — the bright spot should be at the center of your field of view
- Open the field diaphragm until its edges are just outside the visible field
- Adjust the aperture diaphragm (in the condenser): close it until you can see the diaphragm, then open it to about 70–80% of the objective’s back aperture
- Switch to the objective you want to test — Köhler usually stays adjusted, but verify the field diaphragm is still centered
Verification
A correctly set Köhler illumination shows:
- Uniform brightness across the field of view
- No visible image of the lamp filament in the specimen plane
- Maximum effective NA at the objective back aperture
- Sharp, evenly contrasted features on your test slide
If you’re unsure whether Köhler is set correctly, run the USAF test twice — once before adjustment, once after. The improvement (often 1–2 elements) tells you how much resolution was being lost.
The Complete Testing Procedure
Once Köhler is set, the resolution test itself is straightforward.
Step 1 — Mount the Chart
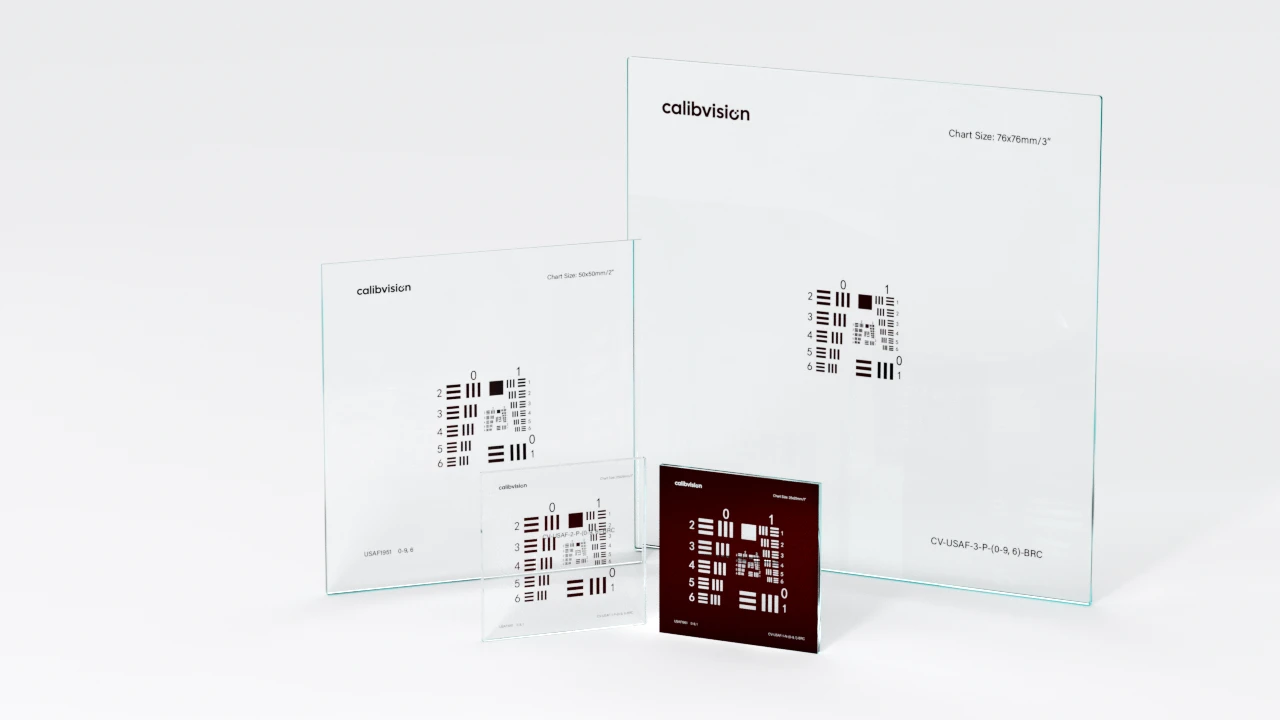
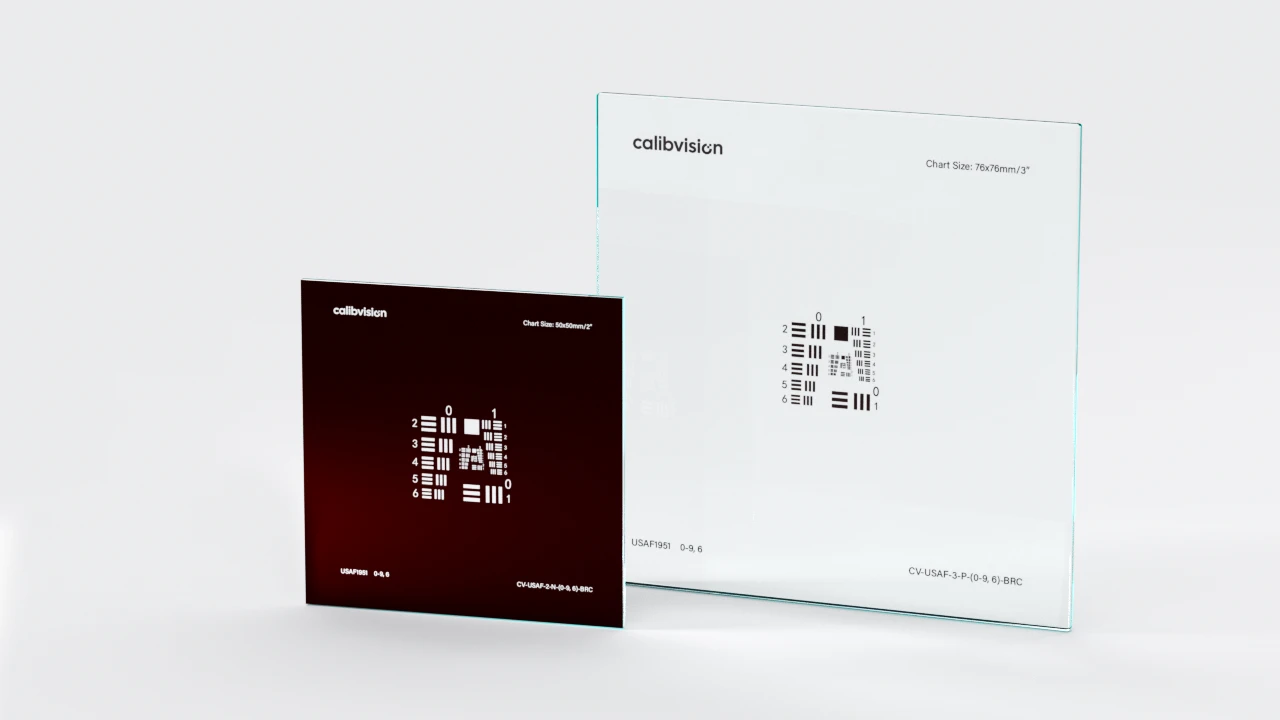
For most microscopes, use a 1″ (25×25 mm) USAF 1951 chart with Positive polarity (chrome on clear glass). The 1″ size fits standard slide holders and provides patterns large enough to find quickly at low magnification.
For brightfield/transmission imaging, choose Positive (chrome pattern on clear substrate). For darkfield, phase contrast, or DIC microscopy, choose Negative (clear pattern on chrome background).
The chart should be a professional manufactured target — not a self-printed or photo-paper version. Sub-micron line accuracy is essential; consumer-grade prints cannot achieve the required precision and will give false negatives (you’ll think your objective is bad when it’s actually fine).
Step 2 — Configure the Microscope
- Manual focus — autofocus systems often lock on the wrong feature on a USAF chart
- Brightfield illumination (unless testing a phase/DIC objective specifically)
- Native camera resolution if photographing the test
- No digital sharpening in the camera or capture software
- RAW or TIFF capture format; never JPEG for measurement
- Correct coverslip: if your objective is marked “0.17 mm cover”, the chart’s glass substrate (typically 1.6 mm or 2.3 mm) is much thicker than 0.17 mm. This is intentional for transmission-mode testing — you’re not putting a coverslip over the chart, you’re using the chart’s substrate as the optical interface
Step 3 — Find Best Focus
This is harder than it sounds for high-NA objectives. The depth of field at NA 0.95 is around 0.5 μm — meaning you need to focus to better than half a micron.
Procedure:
- Start with the center of the chart in view, looking at a mid-range element (e.g., Group 7 Element 1)
- Coarse focus until the bars are recognizable
- Fine focus by sweeping through best focus several times, identifying the exact position where contrast peaks
- Move to the highest-resolution group (innermost layer) and re-focus precisely — best focus may shift slightly due to chart thickness
For very high-NA objectives, consider using focus peaking if your camera supports it, or focus stacking software to capture multiple Z positions and select the sharpest.
Step 4 — Identify the Smallest Resolved Element
Starting from the smallest visible element (highest Group/Element), work outward (larger bars). For each element, verify:
- All three dark bars are distinguishable as separate bars
- Both light gaps between bars are clearly visible
- Contrast modulation is at least ~10% (the Rayleigh visual threshold)
- No aliasing artifacts — the triplet shows exactly 3 bars, not 2 or 4 phantom patterns
- Both orientations resolve — horizontal AND vertical triplets show the same resolution
The first element that satisfies all five criteria, working from smallest outward, is your measured limiting resolution.
Step 5 — Test at Multiple Field Positions
For a complete acceptance test, measure resolution at three locations:
- Center of field — peak performance
- Mid-field (roughly half the radius from center to edge) — typical “useful” zone
- Edge of field — worst case
Use the stage controls to translate the chart, NOT the microscope optics. Each position should be refocused independently — high-NA objectives have curvature of field that puts edges out of focus when the center is in focus.
Step 6 — Compute and Compare
Calculate the resolution at each position using the formula. Compare to the theoretical maximum from the NA table.
Example: a 40× / NA 0.65 objective has theoretical max = 912.30 lp/mm.
| Position | Measured | vs. Theoretical |
| Center | Group 9 Element 6 (912 lp/mm) | At theoretical max ✓ |
| Mid-field | Group 9 Element 4 (724 lp/mm) | 1 element below ✓ |
| Edge | Group 9 Element 1 (512 lp/mm) | 4 elements below — field curvature issue |
This objective passes center performance but has significant field curvature — common in non-plan-apo designs and acceptable for many applications, but worth knowing.
Pass / Fail Acceptance Criteria
What counts as “passing” depends on the objective grade and your application. Typical criteria used by professional microscope labs:
For Plan Objectives (Standard Quality)
| Position | Required performance vs. theoretical |
| Center | Within 1 element of theoretical |
| Mid-field | Within 2 elements of theoretical |
| Edge | Within 3 elements of theoretical |
For Plan Apochromat / High-Grade Objectives
| Position | Required performance vs. theoretical |
| Center | At theoretical (no margin) |
| Mid-field | Within 1 element of center |
| Edge | Within 2 elements of center |
For Teaching / Routine Objectives
| Position | Required performance vs. theoretical |
| Center | Within 2 elements of theoretical |
| Mid-field | Within 3 elements of theoretical |
| Edge | Acceptable if recognizable patterns visible |
If any reading is more than 3 elements below theoretical at center, the objective fails QC and needs investigation. The next sections walk through diagnosis.
Common Problems and What They Indicate
When an objective underperforms, the visual symptoms on the USAF chart often tell you exactly what’s wrong.
Symptom 1: Uniform Softness Across Entire Field
Diagnosis: Objective surface contamination (dust, oil, fingerprints) or Köhler illumination not properly set.
Action: Clean the objective front element with lens tissue and approved optical solvent. Re-verify Köhler. If symptom persists, the objective’s internal elements may need professional service.
Symptom 2: Sharp at Center, Severely Degraded at Edges (Beyond Spec)
Diagnosis: Element decentering from age or mechanical shock; or wrong coverslip thickness.
Action: Check coverslip thickness (must match objective marking, typically 0.17 mm). If still problematic, the objective needs professional service — element re-centering requires manufacturer-level work.
Symptom 3: Vertical Bars Resolve, Horizontal Don’t (or Vice Versa)
Diagnosis: Astigmatism — internal tilt of one or more lens elements, or a damaged element.
Action: Objective needs professional service or replacement. Astigmatism cannot be corrected by user cleaning.
Symptom 4: Color Fringing on High-Contrast Edges (Especially Lateral)
Diagnosis: Chromatic aberration. For “plan apo” (apochromatic) objectives, even mild chromatic aberration is out of spec. For plan achromat or standard plan, some fringing is normal.
Action: If the objective is marked “apochromat” and shows significant color fringing, it’s malfunctioning. Otherwise, this is normal for its grade.
Symptom 5: Visible Bright/Dark Spots in the Field
Diagnosis: Dust or debris inside the objective; or inside the condenser, tube lens, or camera.
Action: Identify the location by removing components one at a time. If on the objective front element, clean. If internal to the objective, requires professional service.
Symptom 6: Image Won’t Come into Focus at High Magnification
Diagnosis: Coverslip mismatch (likely), immersion medium dried up (oil objectives), or specimen on wrong side of slide.
Action: For oil immersion, refresh oil. For dry objectives, verify coverslip thickness or use no coverslip with the chart. For water immersion, ensure water doesn’t dry mid-test.
Symptom 7: Bars Appear, Then Disappear When You Focus Past Them
Diagnosis: Phase reversal at the resolution limit — this is normal and not a defect. It indicates you’ve reached the genuine resolution limit, not an artifact.
Action: None needed. Read the smallest element that shows stable resolution at best focus.
Special Cases by Microscopy Technique
Oil Immersion Objectives (100×, NA 1.25–1.40)
These objectives exceed the USAF 1951 chart’s resolution ceiling. You can still test them, but interpretation differs:
- Apply a drop of fresh immersion oil between the objective and the chart’s glass substrate
- Focus through the oil
- Expectation: Group 9 Element 6 (912.30 lp/mm) should be cleanly resolved
- Pass/fail: If Group 9 Element 6 is fully resolved, the objective passes the available test
- For higher resolution validation, use sub-resolution fluorescent beads (PSF measurement) instead
Don’t expect to see beyond the chart’s max — the bars are physically larger than what the objective can theoretically resolve when above ~NA 0.95.
Water Immersion Objectives (60×, NA 1.20)
Water immersion objectives are designed for live-cell imaging through aqueous media. To test them:
- Apply a drop of distilled water between the objective and chart substrate
- Allow brief stabilization (water has different optical properties than oil)
- Expect to resolve to Group 9 Element 6 (chart max)
If using a glass-only chart (no water-mimicking coverslip), the test gives you upper-bound performance rather than in-application performance. For in-application validation, use a chart with a water-coupled optical interface — usually custom-ordered.
Phase Contrast Objectives
Phase contrast objectives have a phase ring that modifies the appearance of high-contrast structures. To test them:
- Use a Negative-polarity USAF chart (clear pattern on chrome background)
- Set up the phase condenser with the matching annulus
- Focus and read the chart normally
- Expectation: Resolution should match the brightfield NA value
If a phase objective performs significantly worse than its brightfield NA suggests, the phase ring is contaminated or damaged — requires service.
DIC (Differential Interference Contrast) Objectives
DIC objectives include polarization optics that don’t significantly affect resolution but can show shadows on the test pattern. To test:
- Use either polarity USAF chart (Positive is most readable)
- Set up DIC with the Wollaston prism and polarizers
- Read normally, ignoring directional shadows
Fluorescence Objectives
Fluorescence objectives are typically tested under fluorescence conditions rather than brightfield. However, you can do a brightfield USAF test to verify the basic optical performance separate from fluorescence efficiency.
For a fluorescence-specific test, use a fluorescent USAF chart (excitation 365 nm / 405 nm / 488 nm depending on your filter set, available as custom order). This validates both resolution and fluorescence transmission efficiency in one capture.
Polarized Light Microscopy
The USAF chart’s chrome coating is polarization-neutral, so it works under crossed polarizers (the chart will appear darker but patterns remain visible). For specialty polarization-sensitive tests, choose a chart with documented polarization-neutral substrate.
How Often Should You Test Microscope Objectives?
The frequency depends on use intensity and quality requirements:
| Scenario | Recommended frequency |
| ISO 17025 accredited core facility | Every 6 months + after any service |
| Multi-user research lab | Quarterly |
| Single-user dedicated research microscope | Annually |
| Teaching microscopes (high volume) | Every semester / academic term |
| Production/QC microscopes | Per quality system requirements (typically monthly) |
| After any maintenance or cleaning | Always |
| After dropping or mechanical shock | Always |
| Before publication-quality imaging sessions | Before the experiment |
| When inheriting an unfamiliar microscope | Before first use |
| When suspicious of degraded performance | Immediately |
For core facilities, document each test with: date, operator, objective serial number, measured resolution at three field positions, ambient conditions, pass/fail. This builds a longitudinal performance record that catches gradual degradation.
When to Clean vs. When to Replace
Try Cleaning First If:
- Resolution is 1–3 elements below theoretical
- Performance recently changed (was good, now degraded)
- Visible contamination on front element (dust, oil, fingerprints)
- Objective is otherwise in good condition (no scratches, no chips)
Cleaning Procedure (Front Element Only)
- Blow off loose dust with a bulb air blower (not compressed gas — propellant can damage coatings)
- Use a lens tissue soaked in approved optical solvent (typically a 50:50 ether-ethanol mix or a manufacturer-approved cleaner)
- Light pressure, single-direction stroke
- Never reuse the tissue
- Wait for solvent to evaporate before testing
Send for Service If:
- Internal contamination visible (between elements, not just front)
- Element decentering (sharp center, severely degraded edges)
- Astigmatism (one orientation resolves, other doesn’t)
- Coating damage (visible blooming, color irregularities)
- Mechanical damage (housing dents, threads damaged)
Replace If:
- Service cost exceeds 60% of replacement cost
- Discontinued objective with no service availability
- Repeated failures after service
- Coating damage that recurs
Beyond Resolution — Other Quality Dimensions
USAF 1951 testing primarily addresses resolution. For complete objective quality assurance, consider these additional measurements:
Chromatic Aberration
Use the USAF chart with sequential red, green, and blue illumination (color filters or sequential LED). Read the resolution at each wavelength. For plan apochromat objectives, the three readings should be within 1 element of each other. Larger spreads indicate chromatic aberration.
Field Curvature
Already covered by the multi-position USAF testing (center / mid-field / edge). The difference between center and edge readings quantifies field curvature.
Field Flatness (Even Illumination)
Replace the USAF chart with a diffuse white target (white paper or a transmission diffuser). Image and measure pixel brightness across the field. Variations >10% indicate either condenser misalignment or objective vignetting.
Working Distance Verification
Mechanically measure the distance from the objective’s threaded shoulder to the focused specimen plane. Compare to the manufacturer’s specification. Significant deviation indicates the objective has been damaged or modified.
Parfocality
If you have multiple objectives that should be parfocal (focus at the same height), switch between them on a focused specimen. The amount of refocusing required is your parfocality error. >10 μm indicates objective mounting issues.
FAQs
Do I really need a professional test slide, or can I use a microscope calibration slide?
Most “microscope calibration slides” sold for ~$50 are stage micrometers (mm/μm rulers) — useful for measuring specimen size, but not for measuring objective resolution. You need a USAF 1951 chart specifically, with sub-micron line accuracy. A professional 1″ Quartz Glass + Blue Chrome chart (CV-USAF-1QG-P-(0-9, 6)-BLC) is the standard for objectives up to NA 0.95.
Why does my 100× oil objective only show Group 9 Element 6 — shouldn’t it do better?
Group 9 Element 6 (912.30 lp/mm) is the maximum resolution the USAF 1951 chart can show. Your 100× oil objective at NA 1.40 has a theoretical maximum around 2,083 lp/mm — over 2× higher than the chart. You’re seeing the chart’s limit, not the objective’s. To validate beyond 912 lp/mm, use sub-resolution fluorescent beads (200 nm or smaller) for point-spread function analysis.
My objective resolves to Group 9 Element 1, but the spec sheet says it should resolve to Group 9 Element 6. Is it bad?
Maybe. Group 9 Element 1 (512 lp/mm) vs. Element 6 (912 lp/mm) is a 5-element gap, which corresponds to about NA 0.34 vs. NA 0.65 — half the effective resolution. Likely causes: (1) Köhler not set correctly, (2) contamination on the objective, (3) coverslip mismatch, (4) condenser NA limiting effective objective NA. Diagnose in that order.
Can I test fluorescence objectives with a brightfield USAF chart?
Yes for resolution validation, no for fluorescence efficiency. The brightfield test gives you a true measurement of the objective’s optical resolution. For complete fluorescence validation including efficiency, you need either: a fluorescent USAF chart (custom), or sub-resolution fluorescent beads of known intensity.
Should I test the eyepieces too?
Eyepieces add magnification but don’t significantly degrade resolution at well-designed microscopes. They can degrade image quality through vignetting, field flatness, and chromatic aberration. If you’re seeing problems through the eyepieces but not through a camera mounted directly on the trinocular port, the eyepieces are the issue. Otherwise, objective is the main concern.
How accurate is the visual reading? Can I trust my eyes?
For Group 7 and below (≤128 lp/mm), human visual reading is reliable to within ±1 element. For Group 8 and above, the difference between Element 5 and Element 6 can be subjective. For ISO 17025 accredited testing, use a digital camera + image analysis to confirm visual reads at high resolution.
What’s the difference between “limiting resolution” and the published “objective resolution”?
Manufacturers typically publish theoretical Rayleigh-criterion resolution based on NA. Your measured limiting resolution from USAF testing is the real-world resolution including all system losses (illumination, alignment, contamination, coverslip mismatch). The gap between published and measured tells you how well your specific system is performing.
My core facility has 30 objectives. Is there a faster way than this procedure?
Yes — for bulk testing, fix the test setup once: dedicated microscope, dedicated USAF slide, calibrated Köhler. Then for each objective: insert, focus on Group 8 center, read the smallest resolved element, record. ~2 minutes per objective. Schedule for quarterly batch testing with two technicians.
Can I do this test on a fluorescence microscope without brightfield capability?
If the fluorescence microscope has any kind of transmitted light path (even just for finding the specimen), use that. If it’s pure epi-fluorescence with no transmission path, you need either: (a) a fluorescent USAF chart that emits under the microscope’s excitation wavelength, or (b) move the objective to a brightfield microscope for testing.
What if my objective is older than the USAF 1951 standard? Does the test still work?
The USAF 1951 chart is a measurement reference, not specific to any particular optical design era. Objectives from the 1960s, 1980s, modern apochromats — they’re all tested the same way. The chart establishes “ground truth” for resolution; the objective’s design vintage is irrelevant.
How long does a USAF 1951 test slide last?
Chrome-on-glass USAF slides are extremely stable — 10+ years for Quartz Glass versions, 5–10 years for Soda Lime, stored properly. Visible scratches or coating delamination are grounds for replacement. For ISO 17025 labs, recalibration every 3 years is standard.
Choosing the Right Test Slide for Your Microscope
Quick Recommendation by Objective NA
| Your objective NA | Recommended chart |
| ≤ 0.40 (4×–10× standard) | Value Line: CV-USAF-1SG-P-(0-9, 1)-BRC |
| 0.40–0.75 (20×–40×) | Value Line: CV-USAF-1SG-P-(0-9, 1)-BRC or Premium: CV-USAF-1QG-P-(0-9, 6)-BLC |
| ≥ 0.75 (40× apo, 60×, 100×) | Premium: CV-USAF-1QG-P-(0-9, 6)-BLC (required to verify against chart maximum) |
| Mixed objective collection | Premium: CV-USAF-1QG-P-(0-9, 6)-BLC (covers all cases) |
For most microscopists, the Premium 1″ Quartz Glass + Blue Chrome with Element 6 patterns (CV-USAF-1QG-P-(0-9, 6)-BLC) is the right choice — it covers from low-mag to high-NA objectives in a single slide, has the ±20 nm line accuracy needed for accurate high-NA measurement, and the blue chrome anti-glare coating eliminates measurement artifacts from internal reflections.
For darkfield, phase contrast, or DIC microscopists, also add a Negative-polarity chart (CV-USAF-1QG-N-(0-9, 6)-BLC).
Selection Logic Summary
- Size: 1″ (25×25 mm) — fits standard microscope slide holder, perfect specimen-plane coverage
- Substrate: Quartz Glass for high-NA / UV; Soda Lime Glass for routine work
- Coating: Blue Chrome (anti-glare, lower internal reflection)
- Polarity: Positive for brightfield; add Negative for phase/DIC/darkfield
- Pattern range: Element 6 (max 912 lp/mm) for any modern objective work
Conclusion
A 10-minute USAF 1951 test gives you the single most useful objective quality measurement available. Compared to your objective’s theoretical NA-based maximum, the measured limiting resolution tells you whether the objective is performing at spec, marginally degraded, or needs service.
For most microscope users, quarterly or annual testing is sufficient. For core facilities, every 6 months plus after every service. For critical experiments, before every session.
The key takeaways:
- Use a professional USAF 1951 chart (not consumer prints) — sub-micron accuracy is essential
- Set up Köhler illumination correctly — this is where most “bad objective” complaints originate
- Test at three field positions — center, mid-field, edge — for complete characterization
- Compare to NA-based theoretical maximum — within 1 element is passing; 4+ elements below is failing
- Document your tests — longitudinal records catch gradual degradation that single tests miss
With this procedure, you’ll catch objective problems before they ruin experiments, validate every objective in your facility, and have hard data when negotiating with service providers or manufacturers.
Ready to Set Up Your Microscope QC Program?
CalibVision’s 1″ USAF 1951 test slides are the standard reference for microscope objective testing. All slides ship with optional NIM-traceable third-party metrology calibration for ISO 17025 accredited facilities.
Recommended SKUs for microscope users:
| SKU | Best for | Resolution |
| CV-USAF-1QG-P-(0-9, 6)-BLC | Standard brightfield, all NA ranges, recommended default | up to 912.30 lp/mm |
| CV-USAF-1QG-N-(0-9, 6)-BLC | Darkfield, phase contrast, DIC | up to 912.30 lp/mm |
| CV-USAF-1SG-P-(0-9, 1)-BRC | Teaching microscopes, low-NA objectives, budget | up to 512 lp/mm |
For high-volume core facilities, contact CalibVision for bulk pricing and ISO 17025 accredited calibration packages.
Related Reading
- How to Read a USAF 1951 Resolution Chart — Complete Guide — The fundamental formula, group/element layout, and reference tables
- USAF 1951 Product Page — Complete 12-SKU product line specifications