TLDR — The 30-Second Answer
Buy the classic ISO 12233 chart if you need backward compatibility with legacy test rigs, visual resolution reading from hyperbolic wedges, or a single chart that covers 1:1 / 4:3 / 3:2 / 16:9 framing in one shot.
Buy the eSFR ISO chart if you are running automated image quality testing in Imatest or similar software, qualifying high-megapixel sensors, or need a chart that simultaneously measures sharpness, noise, color, and distortion.
Most labs end up owning both — one for the production line, one for R&D.
The Confusion Is Real
If you have searched for an “ISO 12233 test chart” recently, you have probably noticed two very different-looking charts under the same standard name. One is the busy black-and-white chart with H-shaped patterns and curved wedges that has been around since the year 2000. The other is a cleaner chart with slanted squares, gray patches, and color blocks, often called the eSFR ISO chart.
Both are legitimate. Both reference ISO 12233. They are not the same chart, they don’t measure the same things, and buying the wrong one can waste real money. This guide walks you through the difference so you order the right tool the first time.
Side-by-Side Comparison
| Feature | Classic ISO 12233 Chart | eSFR ISO Chart |
| Standard reference | ISO 12233:2000 (still allowed under ISO 12233:2017 Annex I) | ISO 12233:2017 / 2023 |
| Primary patterns | Hyperbolic wedges + slanted edges + zone plate + checkers | 9+ slanted squares + grayscale patches + color patches + optional wedges |
| Edge contrast | High (≥40:1) | Low (4:1) |
| Resolution range | 100 – 2000 LW/PH (Standard) / 100 – 4000 LW/PH (Enhanced) | Limited only by chart size and camera; designed for any modern sensor |
| Aspect ratio markers | 1:1 / 4:3 / 3:2 / 16:9 — all four on one chart | One chart per ratio (3:2 or 16:9) |
| Automated region detection | Manual ROI selection required | Fully automatic in Imatest eSFR ISO module |
| What it measures | Sharpness (SFR/MTF), visual resolution limit | Sharpness, noise, lateral chromatic aberration, distortion, tonal response, color accuracy, aliasing |
| Best for | Visual QC, production-line inspection, legacy compatibility, multi-format work | Automated R&D, high-megapixel sensor characterization, full image quality reports |
| Typical user | Production engineer, lens technician | Image science lab, sensor manufacturer, ISP tuning team |
What Is the Classic ISO 12233 Chart?
The classic ISO 12233 chart was defined in the original ISO 12233:2000 publication and is the chart most people picture when they hear “resolution test chart.” Its defining features are the hyperbolic wedges — those pointed, curved black wedges that converge toward a vanishing point — which let a human inspector read off the limiting resolution by eye, no software required.
The chart packs a lot into one surface:
- Hyperbolic wedges in vertical, horizontal, and diagonal orientations, calibrated in line widths per picture height (LW/PH) so resolution can be read off directly
- Slanted edges for SFR (Spatial Frequency Response) measurement using software like Imatest SFR or sfrmat5
- Aspect-ratio framing marks for 1:1, 4:3, 3:2, and 16:9 — useful when one camera shoots multiple formats
- A center focus zone plate for focus checking
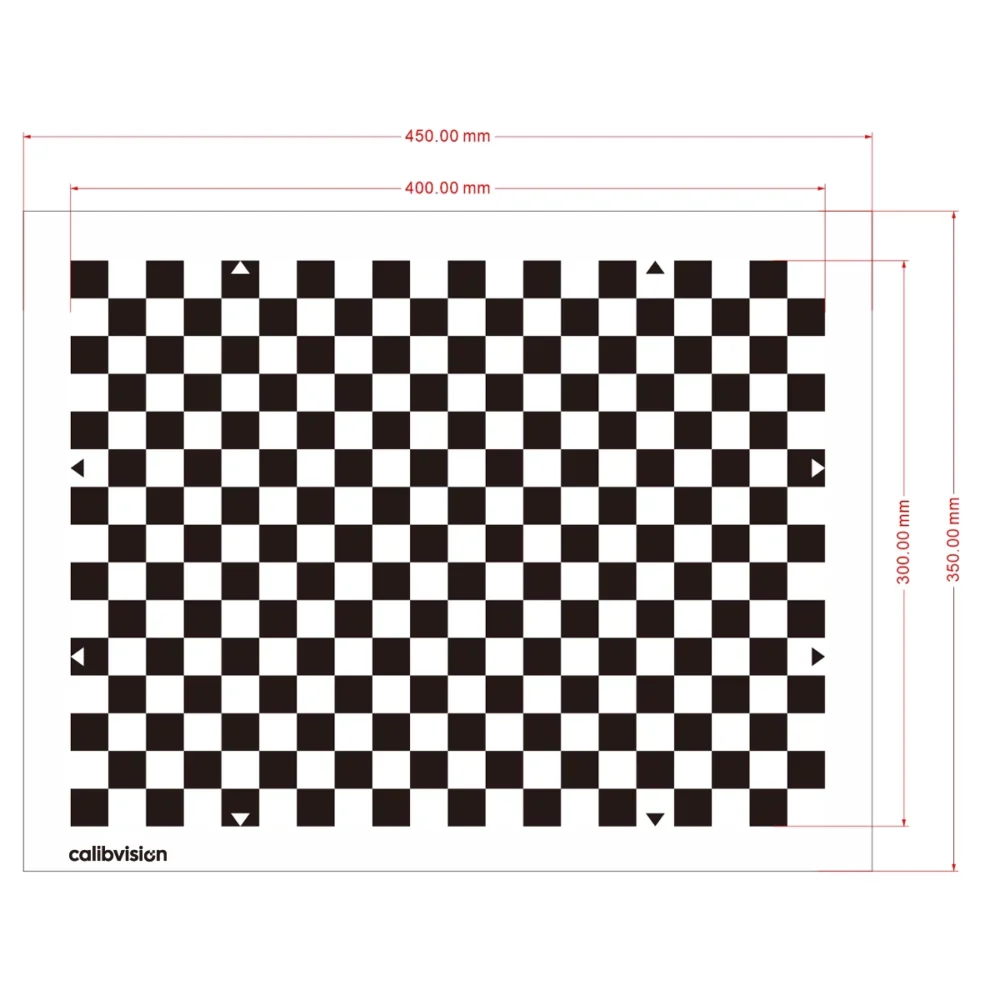
- Checker patterns for visual geometric distortion assessment
The chart’s high edge contrast (40:1 or higher) makes the wedges easy to see, which is exactly what you want for a quick visual check on a production line. The same high contrast, however, is now considered a weakness for software analysis — more on that in a moment.
The Enhanced version of the classic chart (sold by manufacturers like CalibVision, Applied Image, and Lontry) adds a star sector target, a 5° slant bar, and extends visual resolution measurement to 4000 LW/PH, making it usable for sensors well into the 50-megapixel range.
Want to buy one? See the CalibVision ISO 12233 Resolution Test Chart — available in film 0.25X–6X and photographic paper 8X, Standard and Enhanced (Pro) versions.
What Is the eSFR ISO Chart?
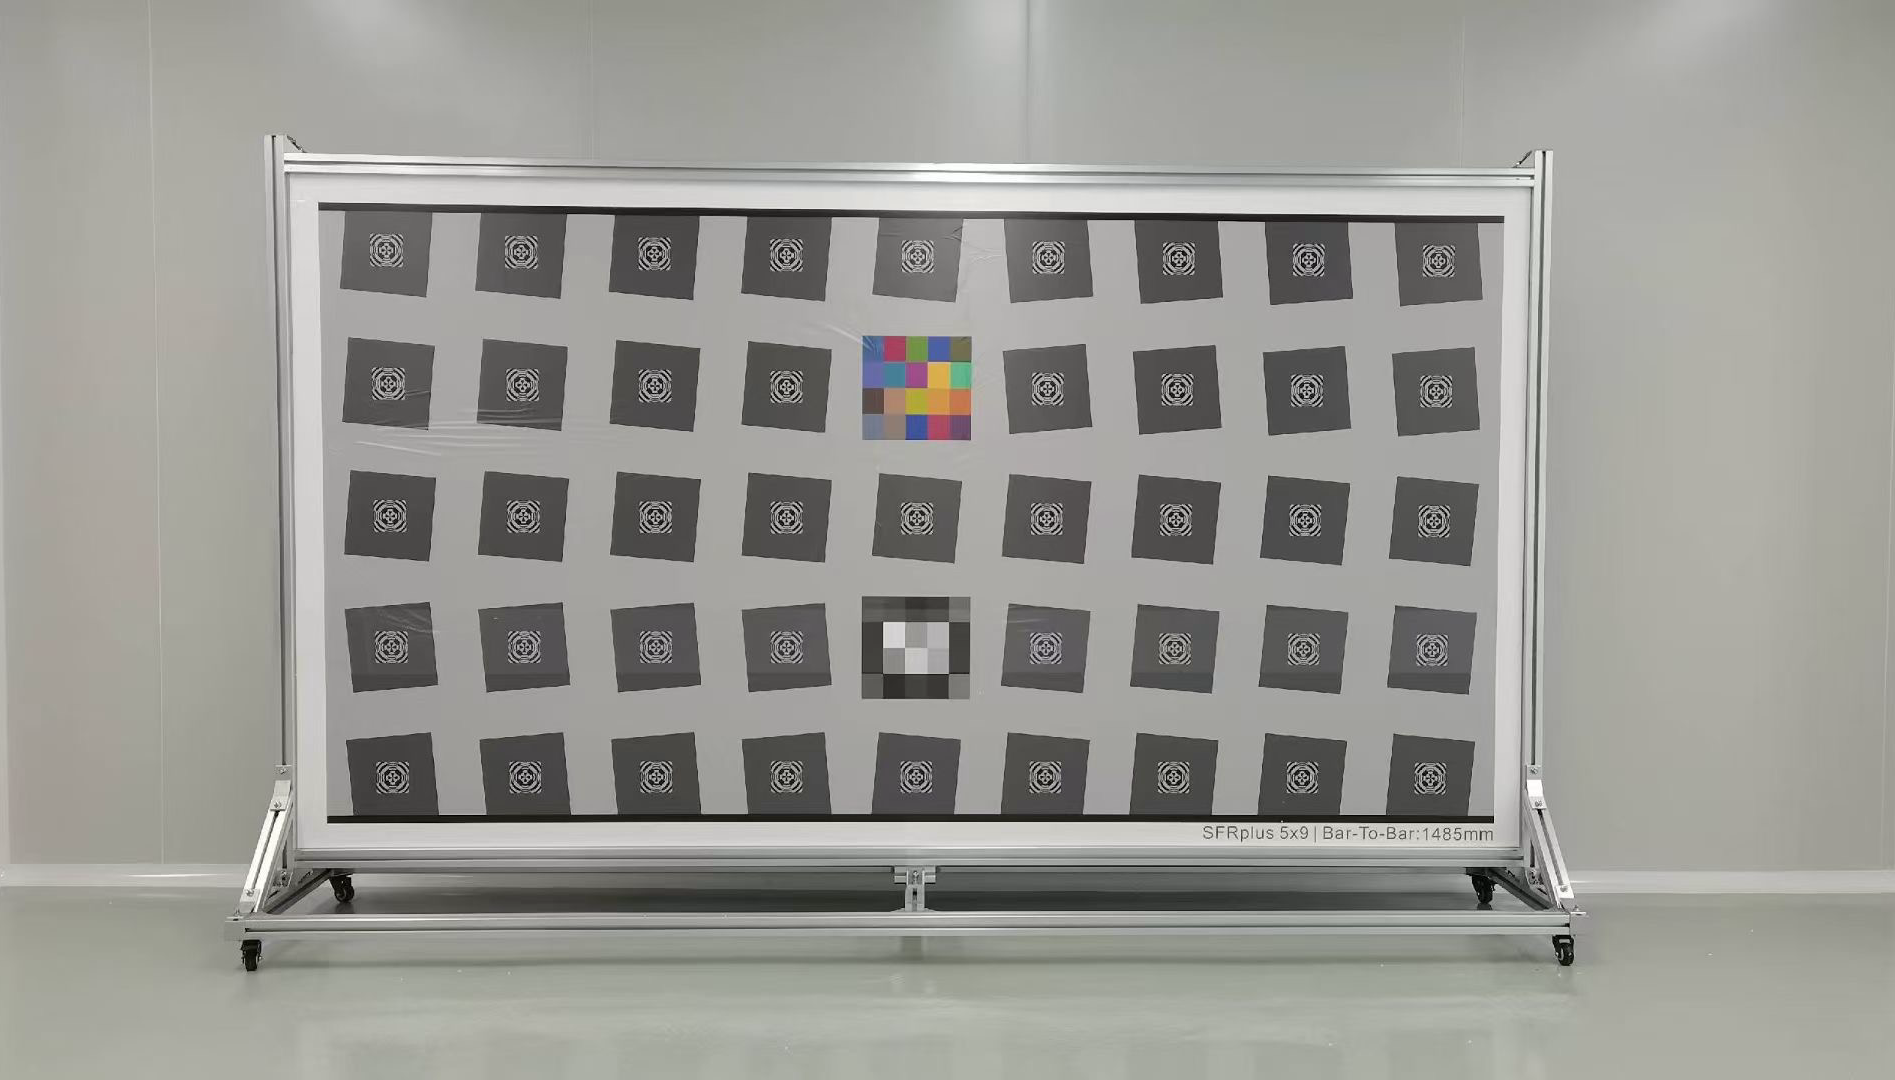
The eSFR ISO chart was introduced as part of ISO 12233:2014 and refined in the 2017 and 2023 revisions. The “e” stands for Edge SFR — the chart is built around precisely placed slanted squares whose edges are used to compute SFR (and from there, MTF).
It looks nothing like the classic chart. Gone are the hyperbolic wedges and the busy patterns. In their place:
- Nine or more slanted squares distributed across the image area, so you get SFR readings at center, mid-field, and corners simultaneously
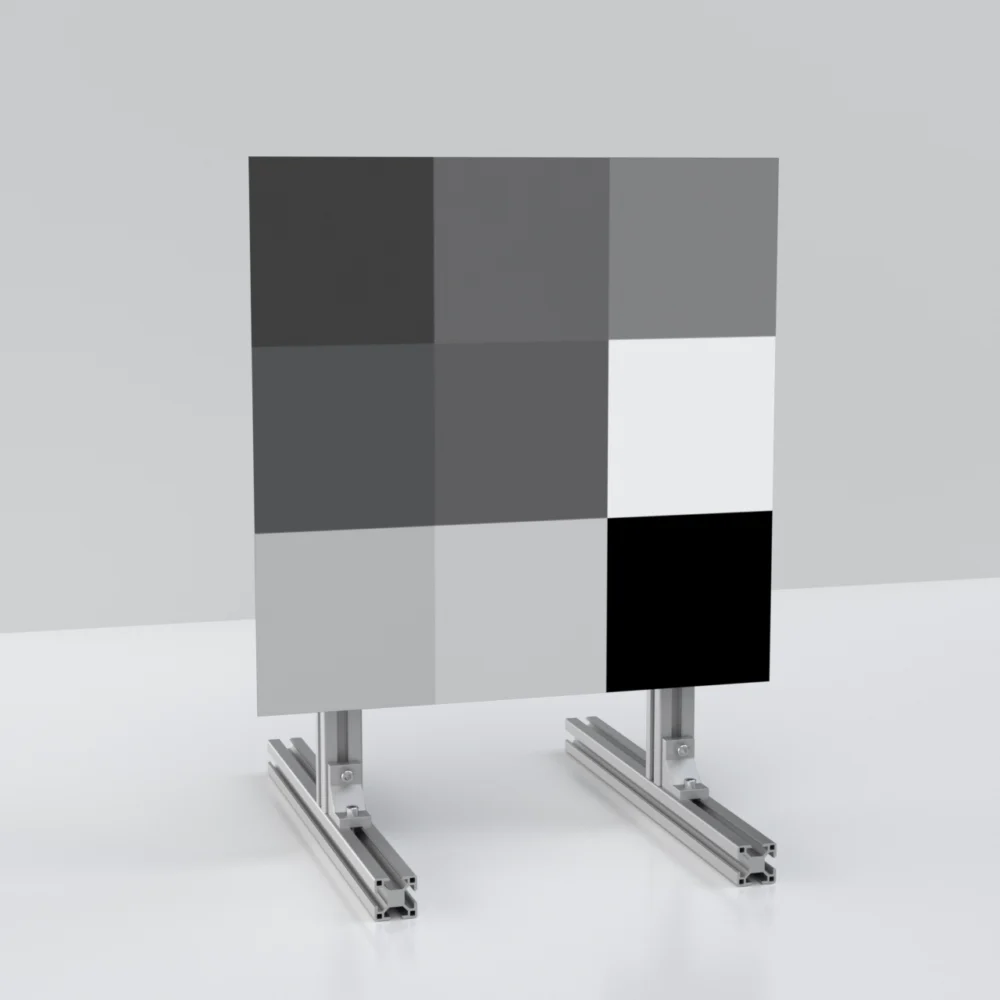
- A 20-patch OECF grayscale ramp for tonal response and noise measurement
- Optional color patches for color accuracy testing (Enhanced/Extended versions)
- Wedges in the corners of Enhanced/Extended versions, for aliasing and Moiré detection
- Registration marks that let software find the chart automatically
The most important technical change is the edge contrast: 4:1 instead of ≥40:1. That sounds counterintuitive — wouldn’t lower contrast make measurement harder? In practice it makes results more accurate, because real-world scenes rarely contain 40:1 edges, and high-contrast edges expose nonlinearities in modern image processing pipelines (sharpening, tone mapping, noise reduction) that distort SFR readings.
The 2023 edition went a step further, replacing the slanted squares with a four-cycle slanted star pattern and switching from hyperbolic to logarithmic wedges for broader spatial frequency coverage.
Want to buy one? See the CalibVision eSFR Test Chart — engineered for Imatest, fully ISO 12233:2017 compliant.
When to Choose the Classic ISO 12233 Chart
Pick the classic chart in any of these situations:
- You need to maintain test-result continuity with measurements taken before 2014. Switching chart designs mid-program breaks comparability. If your QC database has five years of SFR50 readings from the classic chart, keep using it.
- You shoot multiple aspect ratios on the same camera and want to inspect framing alignment for each in one capture. The classic chart’s 1:1 / 4:3 / 3:2 / 16:9 fiducial marks are surprisingly useful in mobile and broadcast workflows.
- You need visual, eyes-only resolution reading. Production technicians can glance at the hyperbolic wedges and call out “1800 LW/PH center, 1400 LW/PH corner” without launching any software. That speed matters when you are inspecting 500 modules a shift.
- You are working at sub-12 megapixel resolution and don’t need the sophistication of automated multi-ROI analysis.
- Your software workflow is older. Some legacy MTF software was written specifically against the classic chart layout and never updated.
When to Choose the eSFR ISO Chart
Pick the eSFR ISO chart when:
- You use Imatest, MTF Mapper, or similar modern software that supports automatic region detection. The eSFR ISO chart’s registration marks are the reason these tools can analyze hundreds of images without human input.
- You are characterizing high-resolution sensors (24 MP and up). The slanted-square geometry and 4:1 contrast give cleaner SFR readings on modern pixel-pitch sensors.
- You need more than just sharpness. The eSFR ISO chart packs noise, tonal response, color accuracy, distortion, and chromatic aberration into one capture. That’s four to five test charts in one.
- You are publishing or submitting test results to standards bodies. Current ISO 12233:2017 and 2023 conformance reporting expects the eSFR chart layout.
- You need a complete sharpness map across the image surface, not just three or four points. The 9+ slanted squares give you center, sides, and corners simultaneously.
The Technical Reason Both Charts Still Exist
There is a common misconception that ISO 12233:2017 “replaced” the classic chart. It did not. Annex I of ISO 12233:2017 explicitly states that the original 2000 chart may still be used for measurements defined in the new standard. This isn’t a quirky carve-out — it’s an acknowledgment that:
- Hundreds of established test labs have decades of data tied to the classic chart layout
- Visual resolution reading from hyperbolic wedges is still the fastest way to flag a defective unit on a production line
- A 1:1 / 4:3 / 3:2 / 16:9 multi-aspect chart genuinely solves a workflow problem the eSFR chart doesn’t address
The two charts coexist because they serve different jobs. The eSFR chart is the better laboratory instrument; the classic chart is the better factory tool.
A Decision Cheat-Sheet
Use this short flowchart when ordering:
| Question | If yes → | If no → |
| Do you have existing data tied to a classic chart? | Classic | Continue |
| Will a human read resolution visually from wedges? | Classic | Continue |
| Do you need sharpness, noise, color, and distortion in one shot? | eSFR | Continue |
| Will Imatest or similar software analyze the image automatically? | eSFR | Continue |
| Is the sensor under test above 24 megapixels? | eSFR | Classic is fine |
If two or more answers point to “Classic,” buy classic. If two or more point to “eSFR,” buy eSFR. If your answers are split, you genuinely need both — and that’s the most common outcome in serious test labs.
What About Film vs Photographic Paper?
The classic-vs-eSFR question is independent of the substrate choice. Both chart designs are available on:
- Transmissive film — backlit, ±15 μm feature accuracy, lab use
- Matte photographic paper — reflective, ±0.1 mm accuracy, field and large-format use
If you are weighing substrate options, see our companion guide: Film vs Photographic Paper ISO 12233 Charts — A Buyer‘s Decision Guide (coming soon).
FAQs
Is the classic ISO 12233 chart obsolete?
No. The original 2000-edition chart is referenced in ISO 12233:2017 Annex I as still valid for the measurement methods defined in the current standard. It is no longer the primary chart of the standard, but it remains a legal and widely used resolution target.
Can I use Imatest with the classic ISO 12233 chart?
Yes, but only with manual region of interest selection. The Imatest SFR module accepts slanted edges from any chart, including the classic one. The fully automated Imatest eSFR ISO module, however, is designed specifically for the eSFR chart layout.
Which chart is better for smartphone camera testing?
The eSFR ISO chart, almost always. Smartphone sensors are typically 12 to 50+ megapixels with sophisticated image processing, and the eSFR chart’s 4:1 contrast and automated multi-ROI analysis match that workflow far better than the classic chart.
Why is the eSFR chart edge contrast only 4:1?
Lower edge contrast keeps the camera operating in its linear response region, avoiding clipping, gamma estimation errors, and nonlinear sharpening artifacts. Real-world scenes rarely contain 40:1 edges, so 4:1 results are more representative of actual image quality.
Do I need both charts?
If your lab does both production QC and detailed R&D characterization, yes. The classic chart is faster for shop-floor checks; the eSFR chart is more thorough for engineering analysis. Many test stations keep both within arm’s reach.
What is the difference between ISO 12233:2017 and ISO 12233:2023?
The 2023 edition replaces the slanted-square pattern with a four-cycle slanted star (for sagittal and tangential SFR), switches from hyperbolic to logarithmic wedges, and adds two color patches. Charts manufactured to the 2017 spec remain valid; 2023 charts add capabilities rather than invalidate older ones.
How accurate are CalibVision ISO 12233 charts?
Both classic and eSFR film charts are manufactured to ±15 μm feature accuracy, verified by a CNAS-accredited third-party calibration lab. Photographic paper versions hold ±0.1 mm. Every unit ships with a serial-numbered dimensional inspection report.
Bottom Line
The classic ISO 12233 chart and the eSFR ISO chart are not competing designs trying to replace each other — they are different tools for different jobs. The classic chart wins on speed, visual reading, and multi-format compatibility. The eSFR chart wins on automation, completeness, and modern sensor coverage.
If you only buy one, base the choice on the workflow (production vs lab, manual vs automated, single metric vs full report), not on which standard year is printed on the corner. And if your work spans both — most serious test labs do — owning one of each is not redundant. It’s a smart division of labor.
Related products
- ISO 12233 Resolution Test Chart (Classic, Hyperbolic Wedge) →
- eSFR ISO Test Chart (ISO 12233:2017 compliant) →
- Need a custom size or pattern? Quote in 24 hours →
Further reading on this blog
- ISO 12233:2000 vs 2017 vs 2024 — How the Standard Evolved (coming next)
- Film vs Photographic Paper ISO 12233 Charts — A Buyer‘s Decision Guide (coming next)
- How to Choose the Right ISO 12233 Chart Size for Your Camera
- What is SFR? Spatial Frequency Response in Camera Resolution Testing