To test LiDAR performance, you need three things: a controlled lab environment, calibrated reflectance targets at known reflectance values (typically 10%, 50%, and 90%), and a measurement protocol that characterizes detection range, range accuracy, and intensity calibration. The standard test sequence places multi-reflectance targets at increasing distances from the LiDAR, records detection probability and reported range/intensity at each distance, and compares against ground-truth measurements. Done correctly, the entire characterization takes 3-5 hours and produces defensible performance data.
This guide walks through the complete test setup — what equipment you need, how to control the environment, how to run the three core test protocols, and the common mistakes that invalidate results. I’ve helped LiDAR engineering teams at automotive OEMs, robotics manufacturers, and metrology labs spec their test setups at CalibVision; this is the practical playbook.
What Equipment Do You Need to Test a LiDAR?
A complete LiDAR performance test setup requires equipment in five categories:
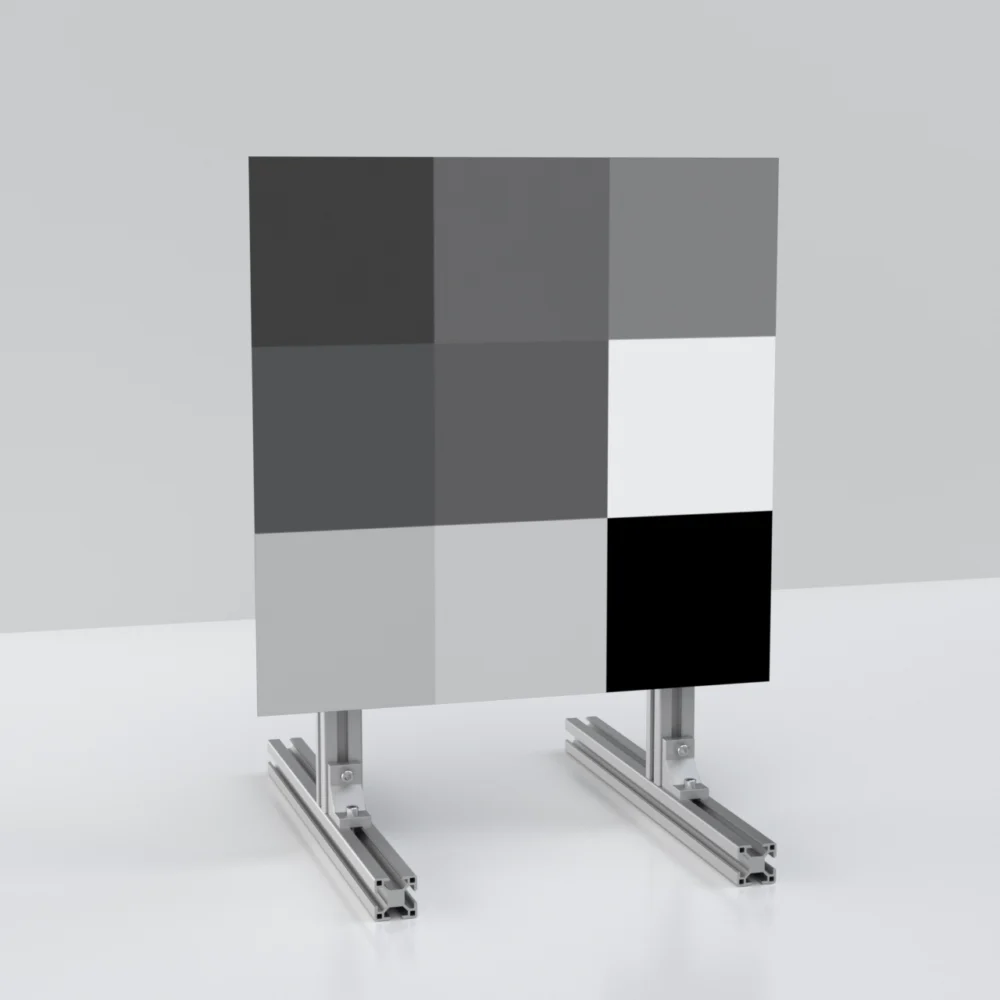
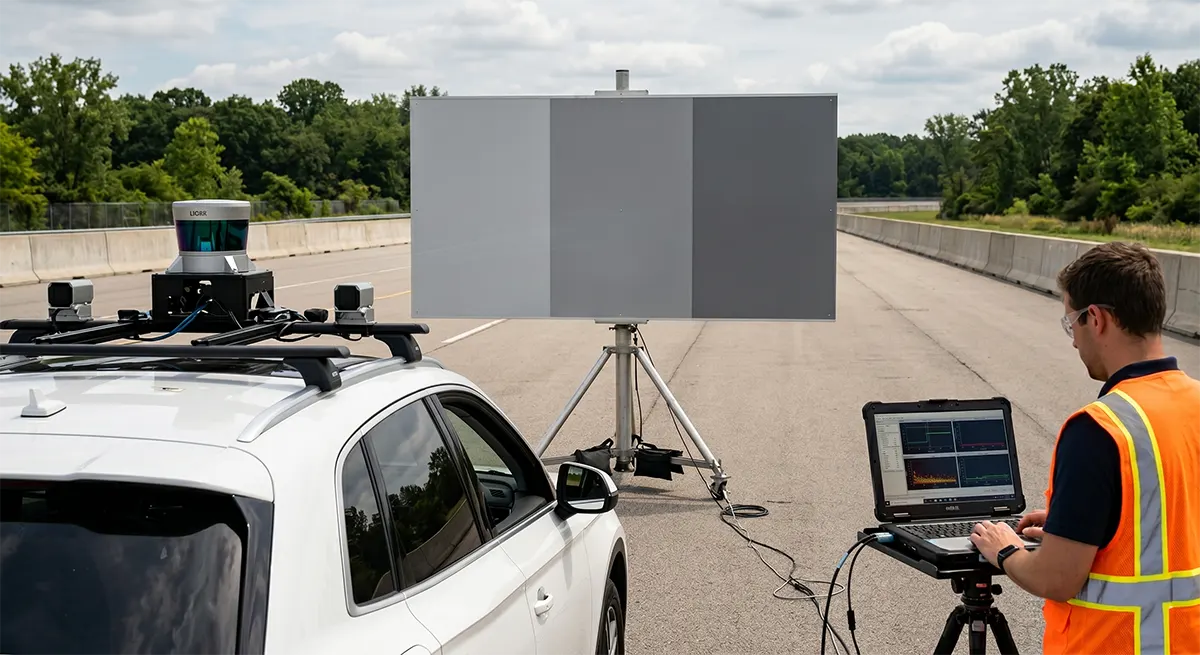
Reflectance targets. A multi-zone reflectance board with 10%, 50%, and 90% Lambertian zones, calibrated at your LiDAR’s specific wavelength (905nm, 1550nm, 940nm, or 850nm). Target size depends on test distance — at minimum, 3x the LiDAR beam footprint at maximum test distance. For automotive LiDAR testing out to 100m, targets at 600×600mm or larger are standard. For long-range automotive (200m+), custom sizes up to 3m × 5m.
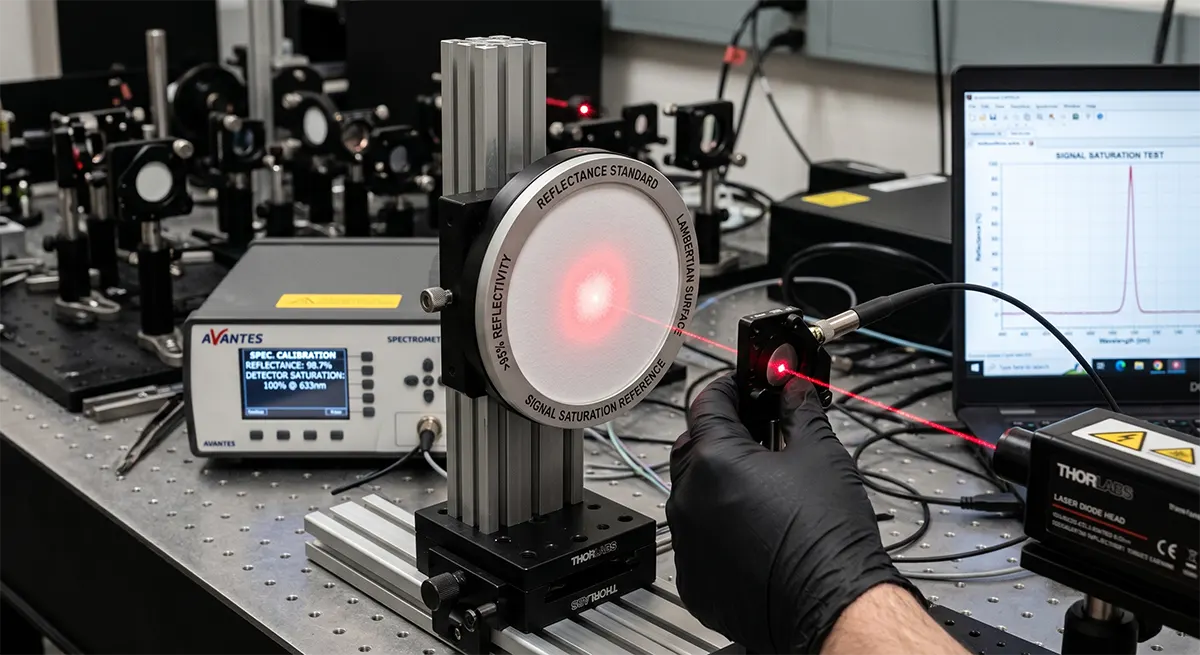
Distance measurement reference. A laser rangefinder, total station, or precision measuring tape that gives you ground-truth distance to ±5mm. Without an independent distance reference, you can’t validate the LiDAR’s reported range.
Mounting hardware. A tilt-and-pan adjustable mount for the LiDAR (allows precise alignment) and a mobile floor stand or fixed mount for the target. The target mount must hold the panel optically flat and at a consistent height between tests.
Environmental controls. Lighting controls (the lab should be in stable indoor lighting — not direct sunlight), temperature monitoring (LiDAR performance varies with sensor temperature), and a clear test path with no reflective surfaces or moving objects in the beam path.
Data acquisition. A computer running the LiDAR’s manufacturer SDK, capturing raw point cloud data at the sensor’s full frame rate, timestamped to the moment of measurement. You’ll analyze this data offline.
The total equipment investment for a basic test setup runs $5,000-$15,000 depending on target size and distance measurement equipment quality. Established automotive OEM test labs spend $50,000-$200,000+ on dedicated LiDAR characterization setups with motorized rails, environmental chambers, and multi-target arrays.
What Lab Environment Conditions Does LiDAR Testing Require?
Five environmental factors affect LiDAR test results:
Ambient lighting must be controlled and stable. Direct sunlight introduces solar near-infrared into the LiDAR’s photodetector, raising the noise floor and reducing effective detection range by 20-40% at the wavelengths most LiDAR uses. Indoor fluorescent and LED lighting is fine; the lab should have no direct sunlight exposure during testing. If outdoor testing is required, run tests at consistent times of day (early morning before solar peak, or after sundown).
Temperature should be stable within ±2°C. LiDAR sensor sensitivity changes with internal temperature — a sensor characterized at 20°C will perform measurably differently at 35°C. Lab temperature should be controlled, monitored, and recorded with each measurement. For sensors deployed across temperature ranges (automotive LiDAR especially), planned tests at 10°C, 20°C, and 35°C give you the working envelope.
No reflective surfaces in the beam path. Walls, floors, ceilings, and equipment near the test path can produce secondary reflections that contaminate measurements. Black anti-reflective curtains or matte black foam panels on potential reflection paths reduce this dramatically. The test path should be physically isolated from optical noise sources.
No moving objects or air disturbance. Walking technicians, opening doors, HVAC airflow, and any moving object in the beam path corrupt single measurements and average measurements. Tests should run with the lab essentially static during data acquisition.
Distance measurement geometry must be controlled. The target should be perfectly perpendicular to the LiDAR’s line-of-sight. Even 5° of target tilt changes the measured reflectance by several percent and shifts the reported range. Use a laser leveling tool to verify perpendicularity before each test.
How Do You Set Up a LiDAR Detection Range Test?
Detection range testing measures the maximum distance at which the LiDAR reliably detects a target of given reflectance. Run separately for each reflectance value (10%, 50%, 90%):
Step 1 — Position the target close. Place the multi-zone target at a starting distance well within the LiDAR’s expected range — typically 5-10m. Verify the LiDAR detects all three zones with high signal-to-noise ratio. This baseline confirms the test setup is working.
Step 2 — Step the target outward. Move the target out in 5m or 10m increments (depending on expected maximum range). At each distance, record:
- Detection probability over 100 frames (how often the LiDAR detects each zone)
- Reported range value
- Reported intensity value
- Timestamp and ambient temperature
Step 3 — Find the detection threshold. Continue stepping outward until detection probability for the 10% zone drops below 90%. This is typically the maximum useful detection range for that LiDAR at low-reflectance conditions. The 50% and 90% zones will continue detecting at greater distances — record those too.
Step 4 — Verify ground-truth distance. At each measurement point, independently measure target distance with the laser rangefinder. The LiDAR’s reported range minus the measured distance is the range error at that distance and reflectance.
Step 5 — Repeat with 50% and 90% targets. Most production-quality LiDAR detects 50% targets reliably to roughly 2x the 10% range, and 90% targets to roughly 3x. The relationship between reflectance and detection range follows a square-root law — useful for predicting performance against scenes you haven’t tested directly.
A complete detection range test for one LiDAR sensor typically takes 1-2 hours and produces 50-100 data points across the three reflectance values.
How Do You Test LiDAR Range Accuracy?
Range accuracy testing measures how closely the LiDAR’s reported distance matches actual distance, across the dynamic range:
Step 1 — Fix the target at a calibrated distance. Position the multi-zone target at a precisely measured distance from the LiDAR — typically 10m, 50m, or 100m, measured to ±5mm with the rangefinder. Verify perpendicularity.
Step 2 — Capture 1000 measurement frames. Run the LiDAR at full frame rate for 30+ seconds, capturing all returned points from the target. The large sample size lets you separate systematic error (calibration offset) from random noise (precision).
Step 3 — Compute statistics per reflectance zone. For each of the three zones, calculate:
- Mean range — the average reported distance
- Range bias — mean range minus ground-truth distance
- Range precision — standard deviation of reported range
- Range accuracy — RMS error against ground truth
Step 4 — Compare across reflectance. Range bias and precision should be roughly consistent across the three zones. If accuracy degrades significantly at the 10% zone (worst signal-to-noise), that’s a real performance limit. If precision degrades at the 90% zone, you may be hitting saturation artifacts.
Step 5 — Repeat at multiple distances. Run the same test at 10m, 50m, and 100m (or distances appropriate to your sensor). Range accuracy may vary with distance — most LiDAR has best accuracy at moderate distances and degrades at the close-range and far-range extremes.
The output of range accuracy testing is a table showing range bias, precision, and accuracy at each combination of distance and reflectance. This is the data you cite when comparing your LiDAR against published specifications or competitor sensors.
How Do You Calibrate LiDAR Intensity Output?
LiDAR intensity values (the “how reflective is this point” output) feed downstream perception algorithms. If intensity output isn’t linear with target reflectance, those downstream algorithms get garbage data:
Step 1 — Position the multi-zone target at fixed distance. Use a moderate distance — 25m or 50m typically — where signal is strong but not saturated.
Step 2 — Record reported intensity for each zone. Capture 1000 frames, average the intensity values for each of the three zones (10%, 50%, 90%).
Step 3 — Check the ratio. A well-calibrated LiDAR should report intensity values in roughly the same ratio as the target reflectance. If 10% zone reads 100, the 50% zone should read approximately 500, and the 90% zone approximately 900.
Step 4 — Identify nonlinearities. If the ratio is wrong (e.g., 10%→100, 50%→400, 90%→700), your sensor’s intensity output has compression at the high end, expansion at the low end, or other nonlinearity. This is a real calibration issue affecting all downstream algorithms.
Step 5 — Document the response curve. Plot reported intensity versus target reflectance for the three measured points. Most LiDAR has a slightly nonlinear response that can be characterized and corrected in post-processing. Some have nonlinearity severe enough to require sensor recalibration.
Intensity calibration is often the test that surfaces hidden problems. A LiDAR can pass detection range and range accuracy tests while producing intensity data that’s unreliable for perception. Always include intensity calibration in your test protocol.
What Mistakes Ruin LiDAR Test Results?
Five common mistakes invalidate test data:
Using a target with the wrong wavelength calibration. A target calibrated for 905nm gives misleading reflectance values when used to test a 1550nm sensor. The 90% target might actually reflect 75% at 1550nm, making your detection range numbers wrong by 15-20%. Always verify target wavelength matches sensor wavelength.
Skipping ground-truth distance verification. Test reports are only as accurate as the distance measurement used to validate them. Engineers sometimes assume the target is “about 50m” based on a tape measure or floor markings — this is a 1-2% error budget that contaminates all derived metrics. Independent distance measurement to ±5mm is non-negotiable.
Testing under uncontrolled lighting. Direct sunlight, varying overhead lights, and reflections off windows all corrupt measurements. Engineers running tests in mixed-lighting labs report wildly inconsistent detection range numbers without knowing why. The fix is environmental control or running tests in identical conditions every time.
Measuring through air with significant disturbance. Forced-air HVAC, foot traffic in the lab, and even temperature gradients across long test paths cause beam refraction and measurement noise. Tests in busy labs produce noisier data than tests run during off-hours.
Not running enough frames. Single-frame measurements are dominated by noise. Detection probability calculations need at least 100 frames per measurement point; range accuracy calculations need 1000+. Engineers in a hurry sometimes capture 10 frames and call it a measurement — the resulting data is statistically meaningless.
The cost of doing tests wrong isn’t just bad data — it’s bad decisions made downstream based on bad data. A LiDAR that “passes” a flawed test program may fail in real deployment, costing far more to debug than running tests correctly the first time.
What Do You Document for Defensible Test Results?
Every test run should produce a structured record:
- Date, time, lab location, and ambient temperature for the test session
- LiDAR model, serial number, and firmware version under test
- Reflectance target serial numbers and calibration dates — you cite these to defend test data
- Distance measurement method and accuracy — laser rangefinder model, calibration date
- Test environment conditions — lighting, temperature stability, isolation from disturbance
- Per-measurement raw data — point cloud captures, frame counts, timestamps
- Computed metrics — detection probability, range bias, range precision, intensity ratios
- Anomalies — anything unusual that occurred during the test, even if it didn’t affect the metric
This structure lets test results survive external scrutiny — automotive OEM acceptance, regulatory review, peer-reviewed publication, or internal audit. Test data without this documentation is essentially folklore.
For automotive LiDAR going through OEM acceptance (Tesla, Waymo, Mobileye, etc.), the documentation requirements expand to cover environmental chambers, multiple test runs at different temperatures, calibration traceability to national metrology standards, and explicit deviation reports against the OEM’s specific test protocol. CalibVision provides reflectance targets traceable to CMA-accredited and CNAS-aligned metrology institutes for these regulated workflows.
How Long Does a Complete LiDAR Performance Test Take?
A complete characterization for one LiDAR sensor takes:
- Setup and alignment — 1-2 hours (target positioning, distance verification, mounting)
- Detection range testing (10%, 50%, 90%) — 1-2 hours
- Range accuracy testing at 3 distances — 2-3 hours
- Intensity calibration — 30-60 minutes
- Documentation and data analysis — 2-4 hours
Total: 6-12 hours of focused lab time for one sensor at one set of environmental conditions. Multi-temperature characterization, multiple sensors, or multiple wavelengths multiplies the time.
Production-line acceptance testing for delivered LiDAR units uses an abbreviated protocol — typically detection at 3 distances and intensity calibration at one distance, total under 30 minutes per unit. The full characterization above is for engineering qualification, not production acceptance.
FAQ
What’s the most important thing to verify before starting a LiDAR test?
The reflectance target wavelength matches your LiDAR wavelength. A target calibrated at 905nm gives wrong reflectance values when used with a 1550nm or 940nm sensor — and the error is large enough to invalidate the entire test. Verify wavelength match before anything else.
Can I test LiDAR performance outdoors?
Yes, but with caveats. Outdoor testing introduces sunlight contamination (especially at 905nm and 940nm where solar irradiance is high), weather variability, and multipath reflections. Outdoor automotive LiDAR test programs run at sundown or before sunrise to control for solar interference, with weather monitoring and run-to-run consistency checks. Indoor testing produces tighter, more repeatable data — outdoor testing produces more representative real-world data.
What’s the difference between detection range and detection probability?
Detection range is the maximum distance at which the sensor can detect the target. Detection probability is the percentage of frames in which it detects the target at a given distance. At short distances, detection probability is essentially 100%. At maximum range, it might be 50-90%. The “useful detection range” is typically defined as the distance where probability remains above 90%.
How do I test LiDAR performance against rain, fog, or snow?
Environmental simulation chambers can produce controlled rain or fog density during testing, characterizing performance degradation in adverse weather. This requires significantly more equipment ($100K+ for a chamber capable of automotive-scale tests) and is typically done by Tier 1 LiDAR suppliers and OEMs with dedicated weather labs. Multi-reflectance targets are still the reference; the chamber simply controls atmospheric conditions between sensor and target.
What’s a typical range accuracy specfor automotive LiDAR?
Modern automotive LiDAR achieves ±2-5cm range precision at moderate distances (20-100m) against the 50% reflectance target, with degraded precision at extreme close range (<10m) and far range (>150m). Datasheet “accuracy” claims should always specify the test conditions — distance, reflectance, and number of frames averaged.
Do I need a multi-zone target, or can I use three separate panels?
Functionally equivalent, but multi-zone boards (10/50/90 on a single rigid panel) save time. With three separate panels, each test cycle requires repositioning the relevant target, re-verifying alignment, and re-checking distance. With a multi-zone board, all three values are measured simultaneously in a single setup. For high-volume production testing, the multi-zone board is faster; for research where you want maximum flexibility (e.g., placing targets at different distances simultaneously), separate panels are useful.
What if my LiDAR’s reported range is off by a constant amount?
A consistent offset (e.g., reported range always 5cm short of true range) is a calibration bias that can be corrected in post-processing or via the sensor’s calibration interface. Random variation around true range (e.g., ±3cm scatter) is sensor noise — not correctable in post-processing, but predictable. The detection range and accuracy tests separate these two types of error so you know which one you have.
How often should I retest a LiDAR sensor?
For research and engineering, retest after major firmware changes, after sensor relocation, or annually as a calibration check. For production-line LiDAR delivered to OEM customers, every unit is acceptance-tested before shipping. For deployed automotive LiDAR (after a vehicle has been on the road), most manufacturers don’t require recalibration — sensor self-diagnostics handle drift detection, with full service-center recalibration only on flagged sensors.
Get Calibrated Reflectance Targets from CalibVision
CalibVision manufactures the calibrated reflectance targets and supporting test hardware described in this guide. Multi-zone boards with seamless 10%/50%/90% reflectance zones are available in standard sizes (18″×36″ and 24″×48″), with custom sizes up to 1500×3000mm. Targets are calibrated at 905nm, 1550nm, 940nm, or 850nm — match the wavelength to your LiDAR.
For lab-grade work requiring traceable certification, we provide bilingual (English/Chinese) calibration reports, CMA-accredited and CNAS-aligned metrology institute submission, and per-panel measurement documentation suitable for ISO audits.
Shop 905nm LiDAR Reflectance Targets → | Browse All Reflectance Standards → | Request Custom Quote →
What to Read Next
- The Complete Guide to LiDAR Reflectance Targets — main reference covering reflectance fundamentals, materials, and applications.
- 10%, 50%, and 90% Reflectance Targets — Which Do You Need? — deep-dive into reflectance value selection for your test program.
- 905nm LiDAR Reflectance Target: Selection and Testing Guide — wavelength-specific guidance for the most common LiDAR systems.
- Lambertian vs Specular vs Retroreflective Targets — fundamentals of LiDAR-grade reflective surfaces.