LiDAR detection range is not a single number. The same sensor that detects a white road sign at 300m might detect a black car at only 100m — and this isn’t a sensor limitation, it’s the fundamental physics of how LiDAR works. Detection range scales with the square root of target reflectance, meaning a 90% reflective target detects at roughly 3× the distance of a 10% reflective target. This relationship is governed by the LiDAR range equation, a physics formula that ties together every variable affecting detection performance.
Understanding the range-reflectance relationship matters for three practical reasons: it’s the only way to interpret datasheet “maximum range” claims accurately, it’s how you predict real-world detection against scenes you haven’t tested directly, and it’s why all professional LiDAR characterization uses multi-reflectance test targets (10/50/90 minimum) rather than a single reflectance value.
This guide walks through the LiDAR range equation, the square-root law, how datasheet specifications can mislead, and how to use reflectance test data to make defensible performance predictions. The math is approachable — this is a physics article first and a marketing piece never.
What Is the LiDAR Range Equation?
For diffuse-target detection (the operational regime that matters for almost all real-world LiDAR work), the maximum detection range follows:
R_max ∝ √(P_laser × ρ_target × A_aperture / NEP)
where:
- R_max = maximum detection range
- P_laser = peak laser power emitted
- ρ_target = target reflectance (a number between 0 and 1)
- A_aperture = receiver aperture area (effective collection area)
- NEP = receiver noise equivalent power (the minimum detectable signal)
The proportionality “∝” hides geometric constants and atmospheric losses, but the relationship between the variables is exact. Each variable affects range through the square root — not linearly. This non-linear scaling is the most important property of the equation, because it means doubling any variable only increases range by 41%, not 100%.
A more complete form of the equation, used for engineering analysis, is:
R_max⁴ = P_laser × ρ_target × A_aperture / (π × NEP × η_atmosphere²)
The fourth-power dependence in this form looks dramatic but is mathematically equivalent to the square-root form above (R_max⁴ becomes R_max when you take the fourth root and the constants reorganize). The key takeaway is the same: every variable affects range sub-linearly.
For practical use, the simplified relationship engineers use day-to-day is:
Range ratio = √(reflectance ratio)
If you measure detection range against a 10% target, you can predict detection range against a 90% target by multiplying by √(0.9/0.1) = √9 = 3. This is the “square-root law” of LiDAR detection range, and it’s the single most useful rule for interpreting LiDAR specifications.
Why Does Detection Range Scale with the Square Root of Reflectance?
The square-root scaling is a direct consequence of how light propagates through space:
Returning signal power decreases with the inverse square of distance. A LiDAR pulse expanding from the sensor follows the inverse-square law in both directions — the outgoing beam spreads as 1/r², and the diffuse return signal also spreads as 1/r². The combined effect is that the received signal power decreases as 1/r⁴.
Detection requires received signal above the noise threshold. The sensor can only detect a return when the received signal power exceeds the receiver’s noise equivalent power (NEP). When R_max⁴ × NEP = P_laser × ρ_target × A_aperture, this equality defines the maximum detection range.
Solving for R_max gives the fourth-root relationship:
R_max = ⁴√(P_laser × ρ_target × A_aperture / NEP / π)
When you reformulate this for the reflectance variable specifically (holding everything else constant):
R_max ∝ ρ_target^(1/4)
Wait — that’s a fourth-root, not a square-root. Why does industry shorthand call it the “square-root law”?
The fourth-root applies when you’re comparing detection range for different targets at the same sensor. The square-root form applies when you’re comparing received signal strength for the same target at different distances. Both are correct; they describe different aspects of the same physics.
For practical use, the fourth-root form is what engineers use for “how does range change with reflectance”:
| Reflectance Ratio | Range Ratio (4th root) |
| 2× brighter target | 1.19× longer range |
| 5× brighter target | 1.50× longer range |
| 9× brighter target (10% → 90%) | 1.73× longer range |
| 10× brighter target | 1.78× longer range |
This is significantly less than the casual “10% target detects at 1/3 the range of 90%” rule of thumb you’ll hear in industry. Where does the difference come from?
The answer is that real-world LiDAR detection includes a detection threshold effect — at low reflectance, returns dip below the noise floor and detection probability drops sharply. The “1/3 the range” rule combines pure physics (fourth-root) with practical detection-probability degradation (which is steeper than the pure physics suggests).
For careful work, use the fourth-root for theoretical predictions and verify with empirical measurements at the actual reflectance values you care about. For rules of thumb and rough estimates, the “1/3 range at 10% vs 90%” approximation is good enough.
How Does Reflectance Affect LiDAR Performance in Practice?
Theoretical physics is one thing; real LiDAR performance is another. Here’s what reflectance actually does in production sensors:
Detection probability changes faster than detection range. A 905nm automotive LiDAR rated for 200m at 10% reflectance might detect at 200m about 90% of the time, at 250m about 50% of the time, and at 300m about 5% of the time. The transition from “reliable detection” to “no detection” spans 50-100m of distance, not a sharp boundary. The “maximum range” specification is typically the distance at which detection probability remains above 90% across multiple frames.
Range accuracy degrades at low reflectance. A LiDAR that achieves ±5cm range accuracy against a 90% target might show ±15cm or worse against a 10% target at the same distance. This is because low-signal returns have lower signal-to-noise ratio, and the timing precision of the return pulse degrades when signal is weak. For applications where range accuracy matters more than maximum range, the test data at low reflectance values is what you should focus on.
Intensity output saturates at high reflectance and close range. A 90% target close to the sensor can saturate the detector, producing intensity values stuck at the upper output limit and sometimes contaminated range measurements. This is why automotive LiDAR test programs specifically test 90% targets at close range — to characterize saturation behavior.
False positives increase at high reflectance. Some LiDAR sensors produce phantom returns when very bright targets are present in the scene — light scatters off surface defects in the sensor optics, off the target’s mounting hardware, or from secondary reflections off lab walls. Bright targets reveal these failure modes; dark targets don’t.
These four effects mean a complete LiDAR characterization needs reflectance values across the full operating range, not just a single value. The standard 10/50/90 trio is the practical minimum.
Why Do LiDAR Datasheet “Maximum Range” Numbers Often Mislead?
Datasheet “max range” claims are a common source of confusion. Here are the patterns to watch for:
The reflectance assumption is often hidden or omitted. A datasheet showing “max range 250m” usually means “max range against a 90% reflectance target.” The same sensor against a 10% target might max out at 80m. Always look for the reflectance specification associated with any range claim.
The probability threshold varies between manufacturers. “Max range” might be defined as “any detection within 1000 frames” (very permissive — essentially the noise-floor distance) or “90% detection probability” (much more conservative — useful detection range). Without knowing the threshold, comparison across manufacturers is meaningless.
The test conditions are rarely specified. Lab conditions vs outdoor conditions, day vs night, clear weather vs adverse weather — all affect detection range significantly. Most datasheets cite ideal lab conditions, which can overstate real-world performance by 30-60%.
The aperture and laser power are often quoted in marketing units. Some manufacturers cite “peak power” (which might be a 1ns pulse) while others cite “average power” or “energy per pulse.” These are not equivalent and can’t be cross-compared directly.
A defensible specification looks like:
“Maximum detection range: 200m at 10% reflectance, 90% detection probability over 100 frames, lab conditions, 905nm wavelength, single-photon detector mode”
Most datasheets are far less specific. When evaluating LiDAR for procurement, ask the manufacturer for the test conditions used to derive their range specifications, and verify with your own multi-reflectance test program if the application is safety-critical.
How Do You Predict Detection Range Against Real-World Surfaces?
The practical use of reflectance test data is predicting how a LiDAR will perform in the field, against scenes you can’t test directly. The methodology:
Step 1 — Characterize against multi-reflectance targets. Detection range at 10%, 50%, and 90% under your test conditions. This gives you three data points on the range-vs-reflectance curve for your specific sensor.
Step 2 — Identify the reflectance of real-world surfaces you care about. A few representative values:
| Real-World Surface | Typical Reflectance at 905nm |
| Black asphalt (fresh) | 5-8% |
| Dark vehicle paint | 5-15% |
| Concrete (gray, dry) | 30-40% |
| Vegetation (green, summer) | 30-50% |
| Concrete (white, dry) | 50-60% |
| Vehicle paint (mid-tone) | 30-50% |
| White vehicle paint | 70-90% |
| Road markings (white paint) | 70-90% |
| Snow (fresh) | 80-95% |
| Retroreflective road signs | 200-1000%+ (apparent reflectance) |
[Note: Retroreflective surfaces appear “brighter than 100%” because they direct most reflected light back toward the source rather than scattering hemispherically.]
Step 3 — Interpolate detection range from your test data. If your sensor detects 10% at 100m and 90% at 280m, the range against a 50% surface (mid-tone vehicle paint, concrete) would be predicted at √(0.5/0.1) × 100 = √5 × 100 ≈ 224m using the square-root rule, or fourth-root method ≈ 150m. Empirical verification at 50% would calibrate which approximation works better for your specific sensor.
Step 4 — Account for environmental factors. Real-world conditions (sun, fog, rain, dust, atmospheric haze) reduce detection range by 20-50% compared to lab conditions. Multiply your predicted range by 0.5-0.8 for outdoor deployment estimates.
Step 5 — Stress-test with sub-10% targets. For safety-critical applications (automotive perception, autonomous robotics), test at 2-5% reflectance to characterize the worst-case dark-vehicle / dark-pedestrian detection. Real-world worst cases are darker than 10%.
This methodology lets you make defensible performance predictions from controlled lab data — the foundation of any LiDAR procurement decision or system design analysis.
What’s the Difference Between Detection Range and Useful Range?
These two terms are often confused but mean very different things:
Detection range is the maximum distance at which the LiDAR can detect any return from the target. Detection probability at this distance might be 5%, 50%, or 90% — different manufacturers and different applications use different probability thresholds.
Useful range is the maximum distance at which the LiDAR’s detection is reliable enough for the application. For automotive perception, “useful range” typically means 90%+ detection probability over multiple frames. For research applications, the threshold might be 50% or even lower.
The two numbers can differ by 30-50%. A LiDAR with “detection range” specified at 300m might have “useful range” of only 200m at the application’s required reliability level.
For safety-critical applications (automotive ADAS, autonomous driving), useful range matters far more than detection range. For exploration or research applications (atmospheric LIDAR, surveying), detection range may be the relevant metric.
When comparing LiDAR specifications, always ask:
- What reflectance is this measured against?
- What detection probability threshold is used?
- What test conditions (lab vs outdoor, weather)?
- What target size was used?
Without these four data points, “max range” specifications are not directly comparable.
How Do You Measure LiDAR Detection Range Reliably?
A defensible detection range measurement follows a structured protocol:
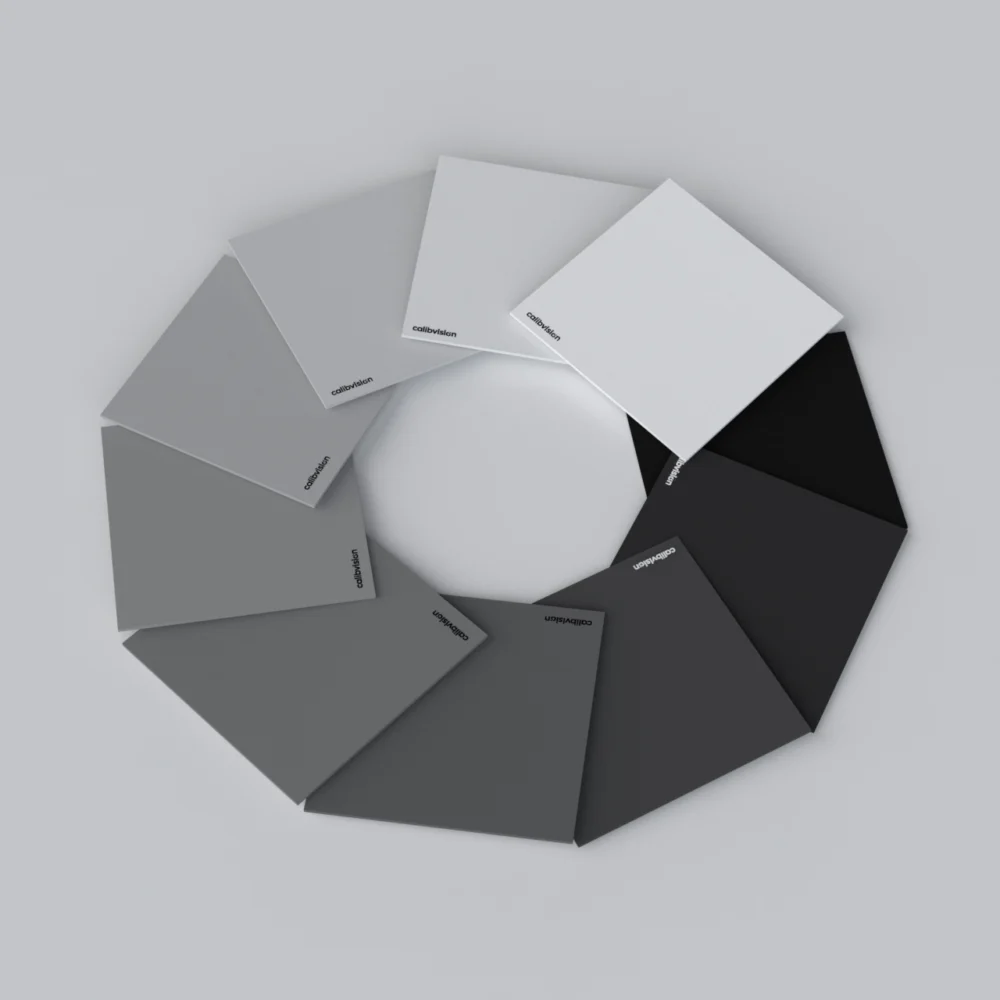
Step 1 — Select the reflectance values to test. Standard practice is 10%, 50%, 90%. For automotive certification, sometimes 5% and 95% are added. For research, more reflectance values (e.g., 5-zone 10/30/50/70/90) give finer characterization.
Step 2 — Set up controlled lab conditions. Stable temperature (±2°C), no direct sunlight, no airflow disturbance, target perpendicular to LiDAR within ±0.5°. The target should be on a stable mount that allows precise distance verification.
Step 3 — Verify ground-truth distance. Use a calibrated laser rangefinder, total station, or precision tape to measure distance from sensor to target with ±5mm accuracy. The LiDAR’s reported range is checked against this ground-truth.
Step 4 — Step the target outward in increments. Start at a distance well within expected range (e.g., 10m). Move out in 10m or 20m increments. At each distance, capture 100-1000 frames and record:
- Detection probability (% of frames detecting the target)
- Reported range (mean and standard deviation)
- Reported intensity (mean and standard deviation)
- Ambient temperature
Step 5 — Find the threshold. Continue stepping outward until detection probability drops below your application’s threshold (typically 90%). This distance is the useful detection range for that reflectance value under those test conditions.
Step 6 — Repeat for each reflectance value. Generate detection range curves for 10%, 50%, 90% (and any additional values your test plan requires).
Step 7 — Document the test conditions. Date, time, temperature, lighting, target serial numbers, sensor firmware version, frame counts. This documentation is what makes test results defensible against external scrutiny — automotive OEM acceptance, regulatory review, or peer-reviewed publication.
A complete detection range characterization across three reflectance values typically takes 2-4 hours of focused lab time. For sensors with detection range above 100m, outdoor test track configuration adds another 4-8 hours including setup and environmental control.
What Should a Complete LiDAR Range Specification Include?
A defensible LiDAR specification documents detection range under specific, reproducible conditions:
Required elements:
- Reflectance value — e.g., “10% Lambertian”
- Detection probability threshold — e.g., “90% probability over 100 frames”
- Test conditions — e.g., “lab indoor, 20°C, no direct sunlight, 50% relative humidity”
- Wavelength — e.g., “905nm”
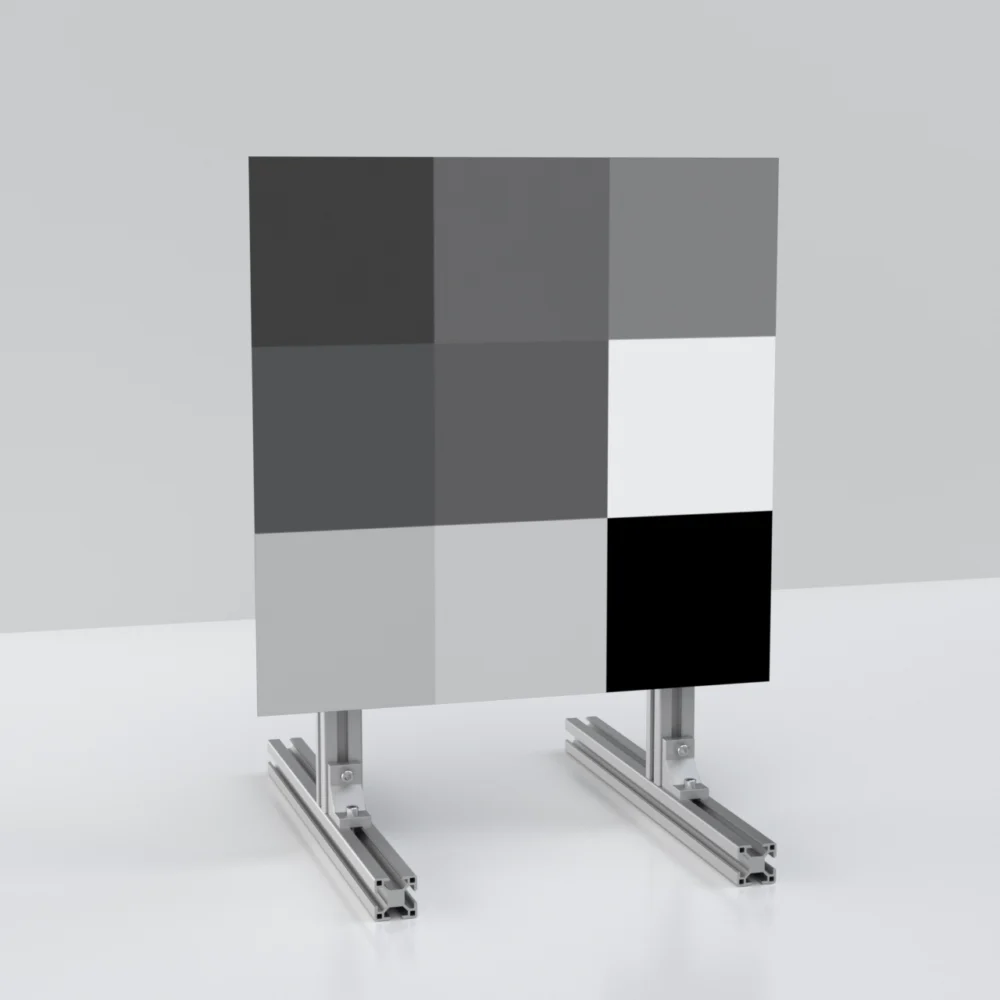
- Target size — e.g., “600 × 600mm Lambertian panel”
- Range measurement method — e.g., “ground truth verified with Leica DISTO laser rangefinder”
Typical example specifications you’ll see in defensible datasheets:
- Maximum detection range: 200m at 10% reflectance, 90% detection probability, lab conditions
- Maximum detection range: 350m at 50% reflectance, 90% detection probability, lab conditions
- Maximum detection range: 500m at 90% reflectance, 90% detection probability, lab conditions
These three values together characterize the sensor’s range envelope. Single numbers without reflectance specification are essentially meaningless for engineering analysis.
For automotive Tier 1 acceptance testing, additional specifications include:
- Detection at multiple environmental conditions (10°C, 35°C operating extremes)
- Detection in adverse weather (rain rate 25mm/hr, fog visibility 200m)
- Detection at multiple sensor mounting angles (for installation flexibility)
- Detection of specific real-world target types (vehicle silhouettes, pedestrian silhouettes)
These extended test programs typically require 40-100+ hours of lab and outdoor characterization, with corresponding documentation overhead.
FAQs
Why does detection range vary so much with reflectance?
The fundamental reason is the inverse-fourth-power relationship between received signal and distance. The outgoing LiDAR pulse spreads as 1/r², and the diffuse return signal also spreads as 1/r² — the combined effect is that received signal decreases as 1/r⁴. To detect a target, received signal must exceed the receiver’s noise floor; to maintain detection at longer range, you need either more reflectance, more laser power, more aperture, or less detector noise. Reflectance is the only one that varies dramatically with the target rather than the sensor.
Is the “1/3 the range at 10% reflectance” rule accurate?
It’s an approximation that works well in many cases but should be verified empirically. The pure-physics fourth-root rule predicts a smaller difference (about 1.7× range advantage from 10% to 90%, not 3× the range). The “3× the range” rule of thumb combines physics with practical detection-probability degradation at low reflectance. For careful engineering work, use the fourth-root for theoretical predictions and verify against test data.
What’s the best way to compare LiDAR sensors from different manufacturers?
Run identical tests under identical conditions. If you can’t, request the test conditions used for each manufacturer’s range specification — including reflectance value, detection probability threshold, test environment, and target details — and normalize across the differences. Without this normalization, comparing “Maximum range: 250m” specifications between manufacturers is statistically meaningless.
Does temperature affect detection range?
Yes. LiDAR sensor sensitivity varies with detector temperature, and ambient temperature affects both detector and laser performance. For 905nm sensors, range typically degrades 5-15% when temperature shifts from 20°C to 40°C; for 1550nm sensors, the effect can be more pronounced because InGaAs detectors are more temperature-sensitive than silicon. Production-grade automotive LiDAR is designed to maintain specifications across operating temperature range, but research sensors may show larger variation.
How does atmospheric humidity affect detection range?
Water vapor absorbs LiDAR energy slightly differently at each wavelength. At 905nm and 1550nm, atmospheric humidity has minimal effect on detection range under normal conditions (less than 5%). In heavy fog, rain, or high-density particulate conditions, attenuation increases significantly — both wavelengths show 30-60% detection range reduction in heavy fog. 1550nm has a slight advantage in dry dust; 905nm has a slight advantage in moderate fog. The difference is rarely operationally decisive.
Why is detection range different for retroreflective targets?
Retroreflective surfaces (road signs, license plates) return light directly back toward the source rather than scattering hemispherically. The return signal can be 100-1000× stronger than from a Lambertian target of the same nominal reflectance. This dramatically extends detection range — a road sign at 90% retroreflective is visible at far longer range than a 90% Lambertian target. However, the strong return signal can saturate the LiDAR’s photodetector, sometimes causing detection failures or false positives. Retroreflective scene elements require their own characterization, separate from Lambertian range testing.
Can I compute detection range without testing, just from sensor specifications?
Approximately, but with significant uncertainty. The LiDAR range equation gives a theoretical detection range from sensor parameters (laser power, aperture, NEP) and target reflectance, but real-world detection involves detector saturation, sub-detection-threshold returns, and signal processing thresholds that the simplified equation doesn’t capture. Theoretical predictions are typically 30-50% higher than empirical detection range. For procurement decisions, always require empirical test data — preferably your own.
What’s the most common mistake in interpreting LiDAR specifications?
Treating “maximum range” as a single, comparable number. The reflectance assumption is often missing or buried in fine print, and different manufacturers use different detection probability thresholds. Two LiDAR sensors with identical “maximum range” specifications can have radically different real-world performance because the test conditions differ. Always request the complete specification (reflectance, probability, conditions) before comparison.
Get Reflectance Targets for LiDAR Range Testing from CalibVision
CalibVision manufactures the calibrated multi-reflectance targets needed for defensible LiDAR detection range testing. Standard multi-zone boards (10%/50%/90% Lambertian zones on a single panel) at 18″×36″ and 24″×48″ cover most testing programs; custom configurations support 5-zone gradient boards (10/30/50/70/90), sub-10% stress-test targets, and oversized panels up to 3m × 5m for long-range outdoor characterization.
Every target ships with per-panel calibration measurement at the specified wavelength (905nm, 1550nm, 940nm, or 850nm). For OEM acceptance testing requiring formal traceability, CMA-accredited and CNAS-aligned metrology institute certification is available as an optional add-on.
Shop Multi-Zone Reflectance Targets → | Browse 905nm Targets → | Request Custom Quote →
What to Read Next
- The Complete Guide to LiDAR Reflectance Targets — main reference covering reflectance fundamentals, materials, and applications.
- 10%, 50%, and 90% Reflectance Targets — Which Do You Need? — selection guide for the standard reflectance values discussed in this article.
- How to Test LiDAR Performance with Reflectance Targets — step-by-step lab setup applying the methodology described above.
- 905nm LiDAR Reflectance Target — Selection & Testing Guide — wavelength-specific application of detection range physics.
- 1550nm LiDAR Reflectance Target — Long-Range Automotive Testing — how detection range scales with the long-range automotive wavelength.
- Lambertian vs Specular vs Retroreflective Targets — surface mode fundamentals affecting detection range calculations.
References
- Steinvall, O. (2000). Effects of target shape and reflection on laser radar cross sections. Applied Optics, 39(24), 4381-4391. — Foundational paper on LiDAR range equation derivation.
- Wojtanowski, J., et al. (2014). Comparison of 905 nm and 1550 nm semiconductor laser rangefinders’ performance deterioration due to adverse environmental conditions. Opto-Electronics Review, 22(3), 183-190.
- IEC 60825-1:2014. Safety of Laser Products — Part 1: Equipment Classification and Requirements.
- SAE International. SAE J3088: LIDAR Performance Specification (in development) — automotive LiDAR characterization standard.
- Industry datasheet analysis (2025-2026) — Hesai, Velodyne, RoboSense, Luminar, Aeva, Innoviz published specifications.