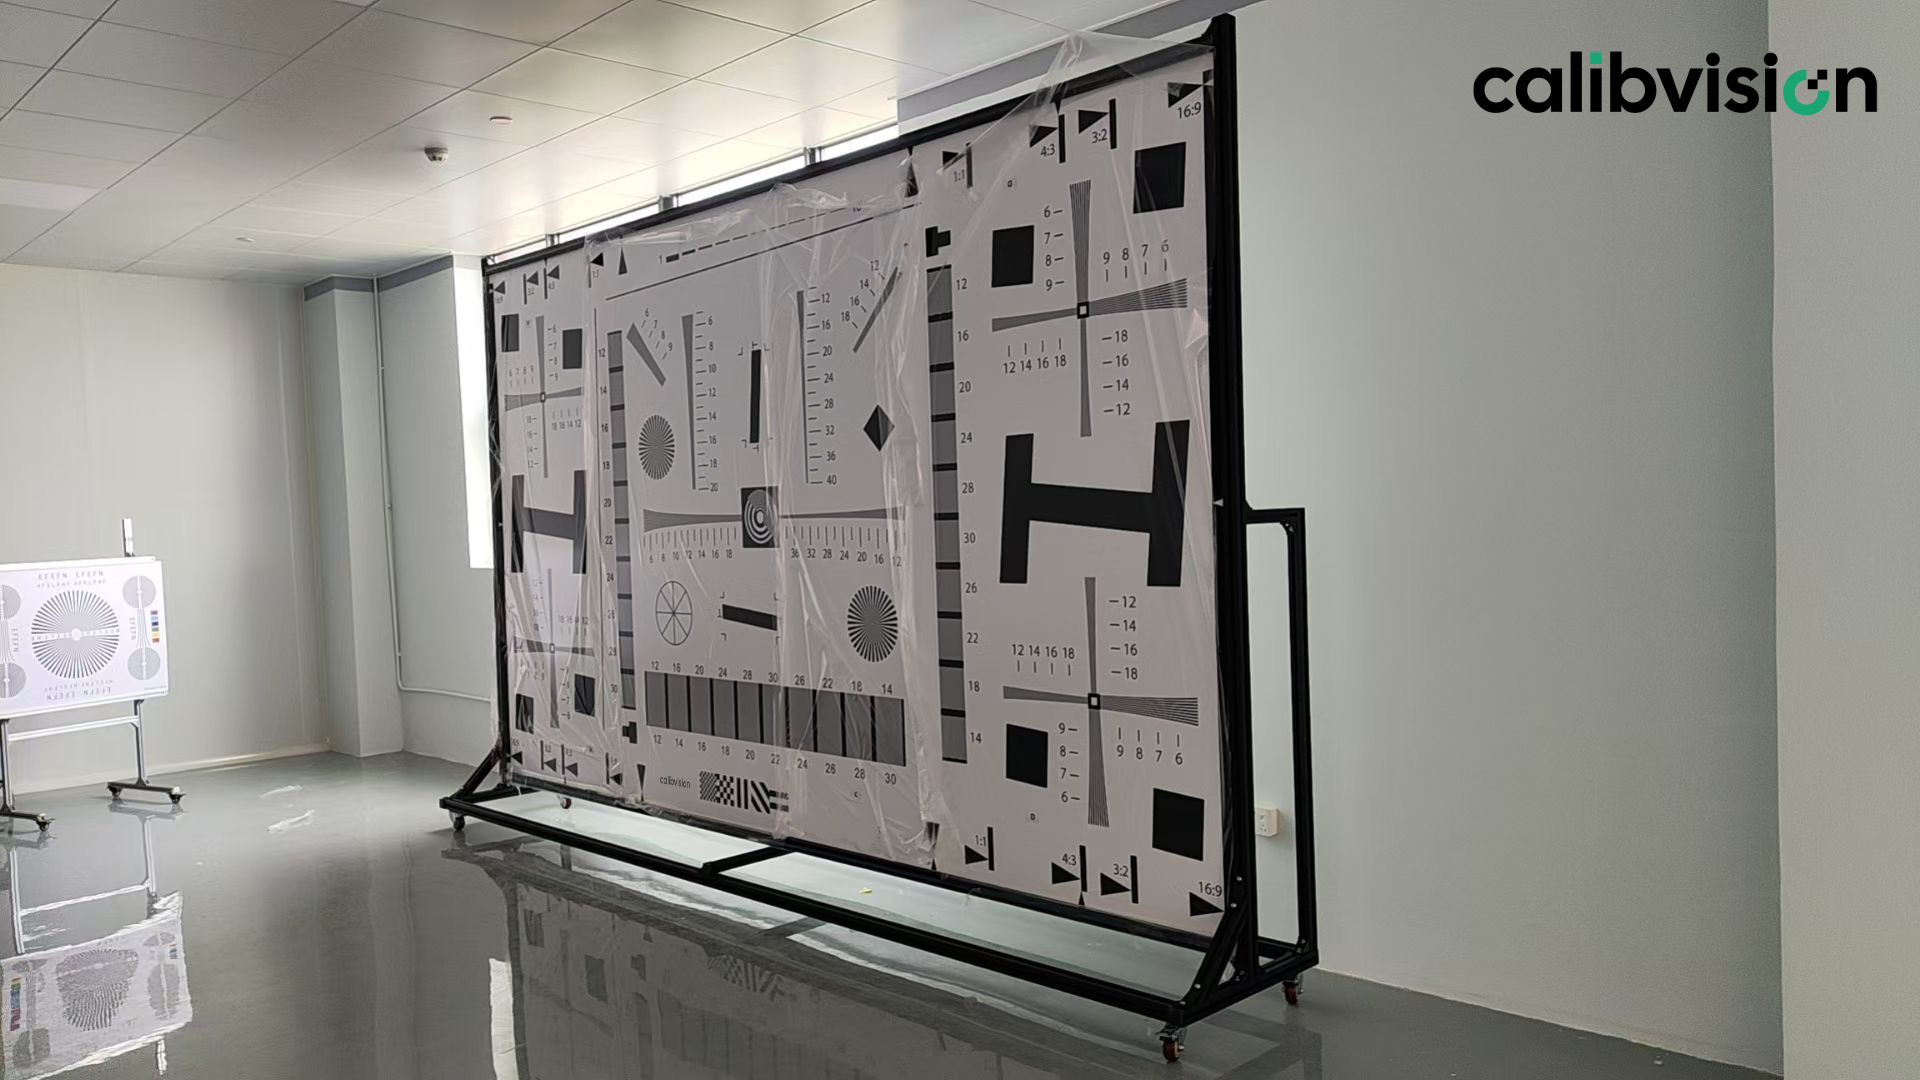
Most people reading this only need the Standard chart. We’ll say that up front, because the internet is full of “buy the premium version” advice written by people who profit from the upgrade, and you deserve a straighter answer than that.
But “most” is not “all.” There is a specific set of measurements the Standard ISO 12233 chart physically cannot give you, and if your work needs one of them, buying Standard isn’t saving money — it’s buying a chart you’ll have to replace mid-project, after you’ve already lost a week discovering its limits. The cost of under-buying is much higher than the cost of over-buying, and that asymmetry is the whole decision.
This post is the version-selection companion to our Complete Guide to ISO 12233 Test Charts. By the end you’ll know exactly which of the two camps you’re in, with a five-question decision check you can run in two minutes.
What’s the difference between the Standard and Enhanced ISO 12233 chart?
The Standard chart carries hyperbolic wedges, slanted edges and registration marks — enough for visual resolution and basic SFR. The Enhanced (Pro) chart adds six slanted squares near the image boundaries, OECF grayscale patches, color patches, and a sine-wave star. Those additions unlock corner-to-corner SFR mapping, properly linearised measurements, tonal and color analysis, and texture/aliasing metrics that the Standard chart cannot provide.
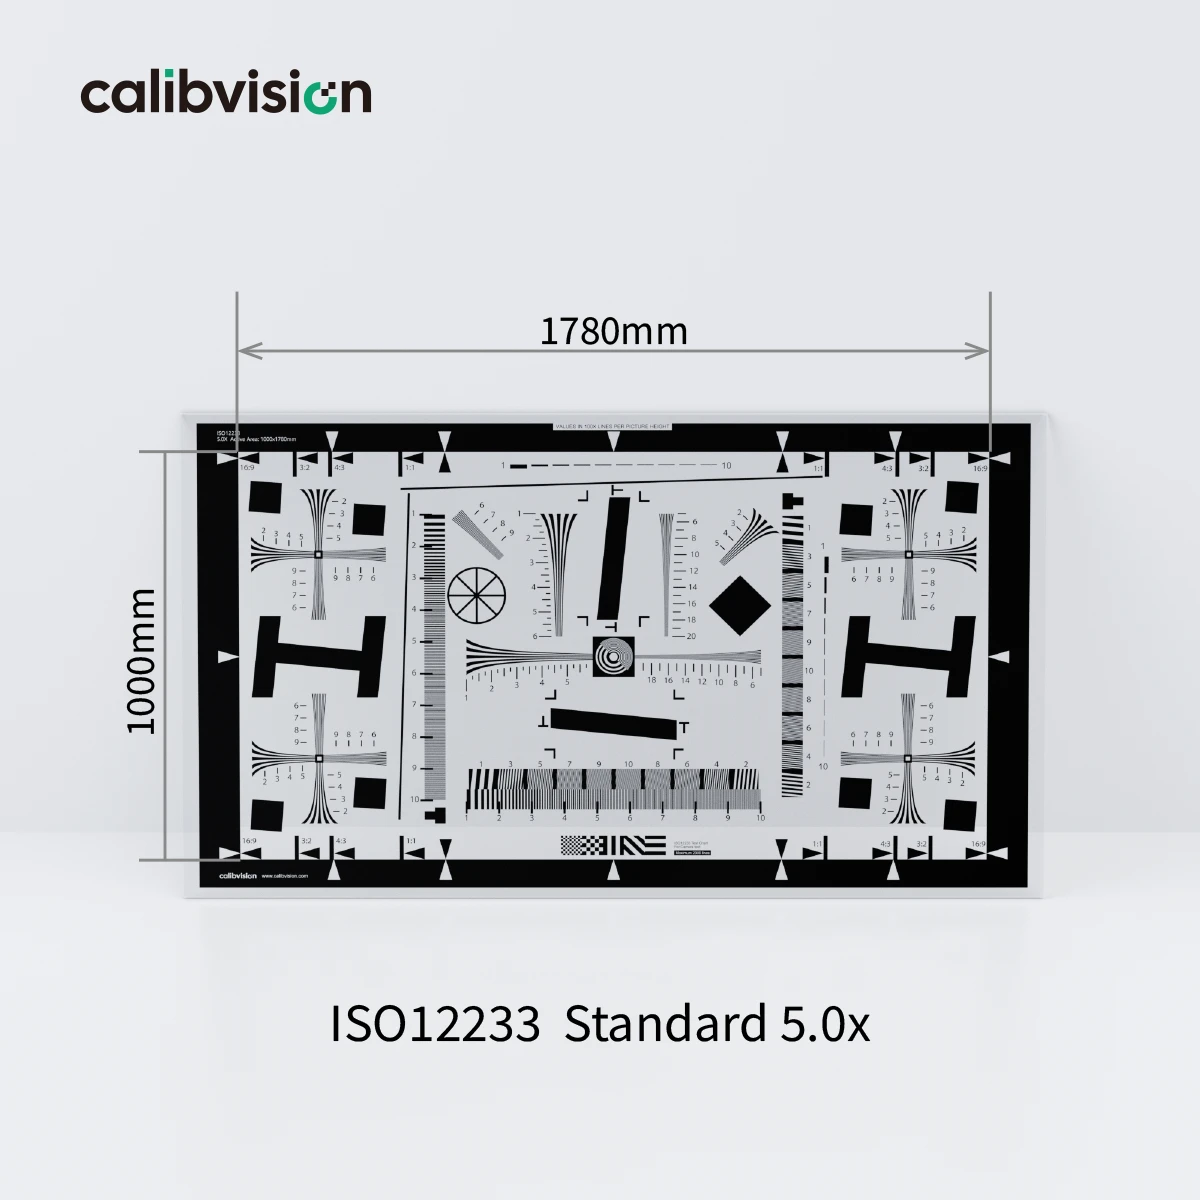
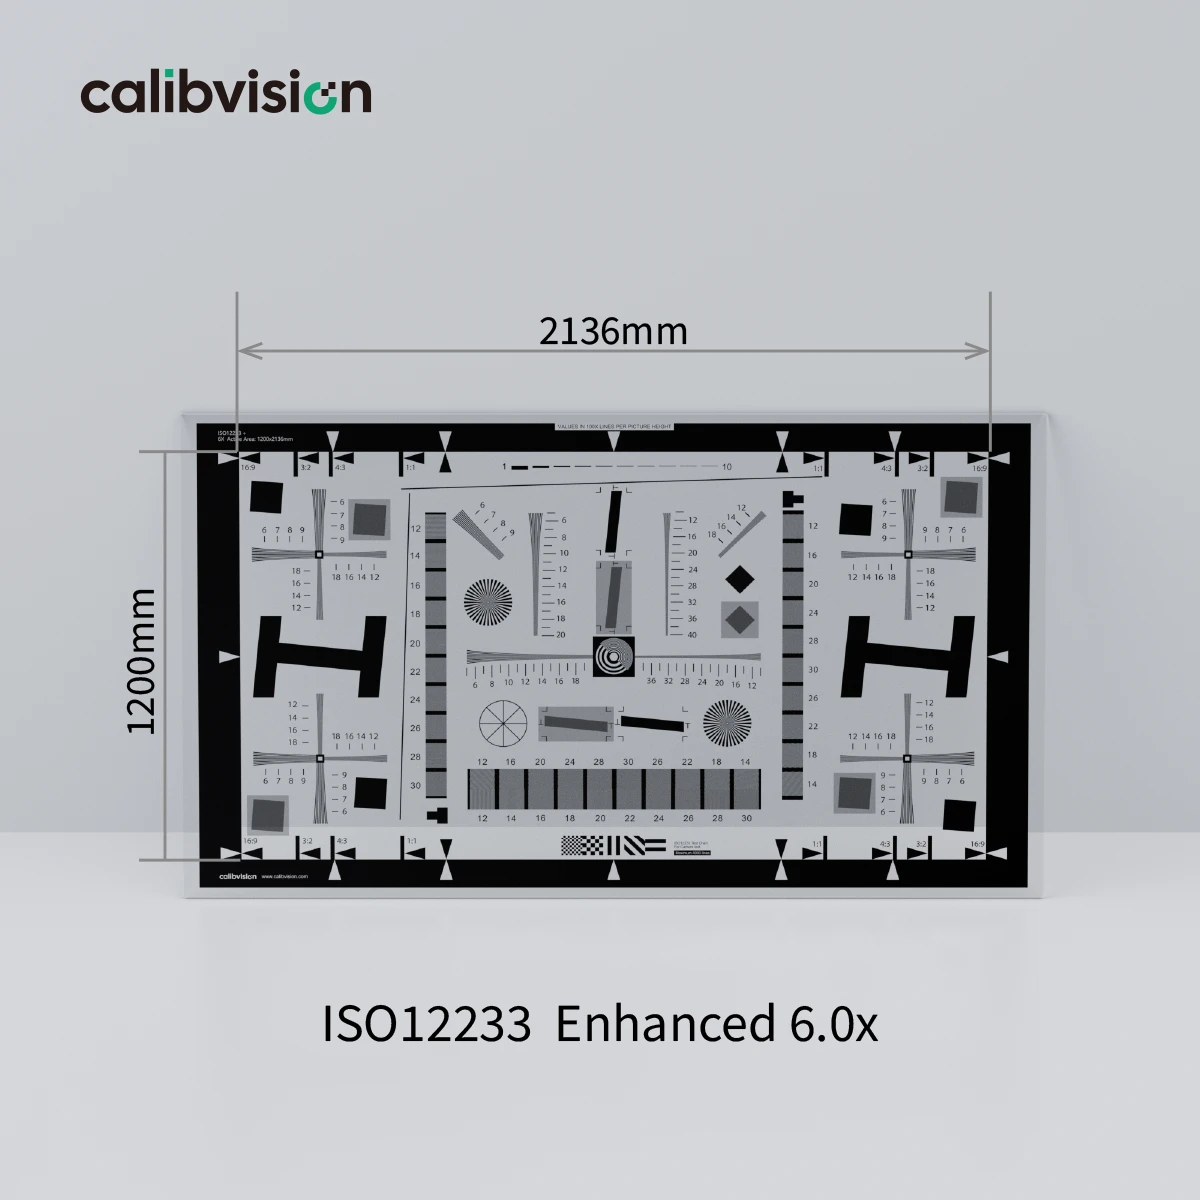
In one line: Standard measures sharpness at the center; Enhanced measures sharpness everywhere, properly linearised, plus tone, color and texture. Whether you need the second sentence is what the rest of this guide decides.
| Feature | Standard | Enhanced (Pro) | What it unlocks |
| Hyperbolic wedges | Yes | Yes | Visual / limiting resolution (by eye or wedge software) |
| Center slanted edges | Yes | Yes | Center SFR / MTF (slanted-edge method) |
| Registration / fiducials | Yes | Yes | Automatic chart detection by software |
| High-frequency sweeps | Yes | Yes | Limiting resolution, perceived sharpness |
| Six boundary slanted squares | – | Yes | SFR at the field edges and corners |
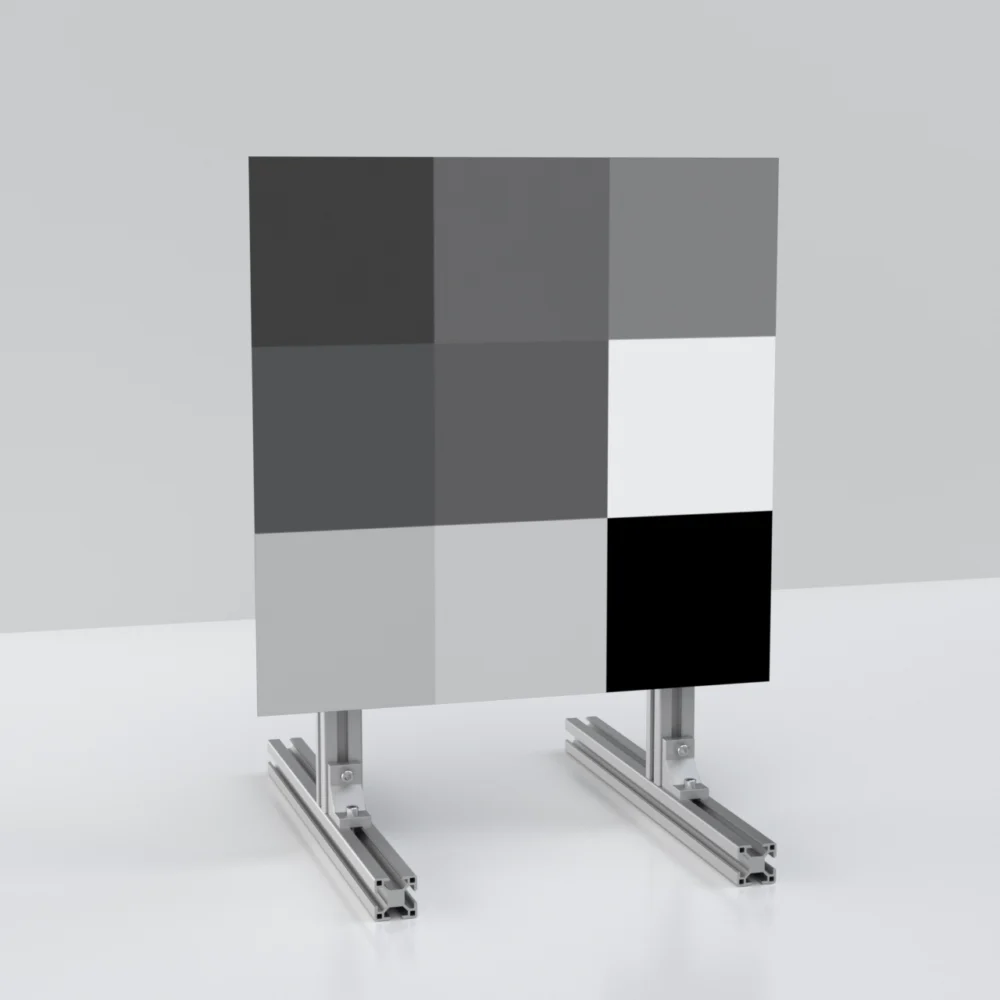
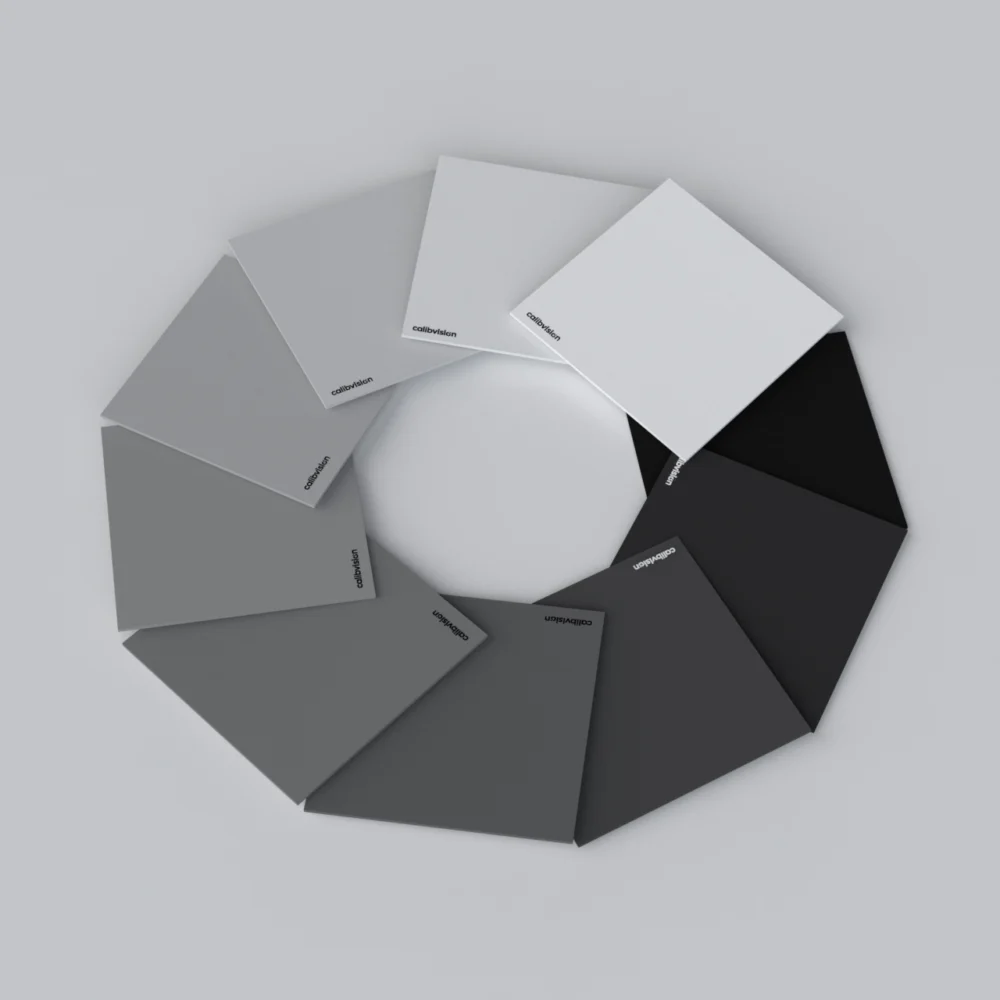
| OECF grayscale patches | – | Yes | Tonal response + linearisation for accurate SFR |
| Color patches | – | Yes | Color accuracy (Colorchecker-style) |
| Sine-wave star | – | Yes | s-SFR, texture loss, astigmatism, aliasing |
The four bolded rows are the entire price difference. Everything above them, both charts share. So the real question is not “is Enhanced better” — of course it has more features — it’s “do I need any of those four things.”
When the Standard chart is genuinely enough
Don’t pay for Enhanced if your work lives entirely inside this list. For these jobs, the Standard chart gives you the same answer Enhanced would, at lower cost:
- Go / no-go QC on a production line. You’re checking that modules haven’t drifted from a known-good baseline. A center SFR reading and a visual wedge check catch drift fine.
- Visual / limiting resolution checks. Reading the wedges by eye or with wedge software to confirm a camera resolves to spec.
- Quick lens comparisons where you only care about center sharpness and relative ranking (“is lens A sharper than lens B in the middle”).
- Incoming-inspection of a known camera against a known number.
- Teaching, demos, and field reference where center SFR and visual resolution are the whole point.
- Cameras with small, well-corrected sensors where corner performance isn’t a differentiator you’re chasing.
If that’s your world, the honest recommendation is: buy Standard, spend the difference on a better light box or a rigid mounting panel — both of which will improve your measurement repeatability more than the extra chart features would. (See § on lighting and mounting in our Common Mistakes guide — setup quality moves your numbers more than chart tier does, for center-only work.)
The four moments the Standard chart fails you
Here’s the other side. Each of these is a real measurement need, and in each case Standard physically cannot deliver it. If even one applies to you, you need Enhanced.
- You need SFR at the corners, not just the center
The Standard chart’s slanted edges are clustered toward the center. To measure how a lens performs at the field edges and corners — where almost all lenses fall off, and where the difference between a good and a bad lens actually lives — you need the six boundary slanted squares that only the Enhanced chart carries.
If your job involves characterising a lens (R&D, lens selection, supplier comparison, qualifying a new optical design) rather than just monitoring a known one, corner SFR is not optional. Center-only data will make a lens with bad corners look acceptable, and you’ll find out from the field returns.
- You need a properly linearised SFR (this is the subtle one)
This is the argument most version comparisons miss. The slanted-edge SFR algorithm assumes it’s working on linearised image data — a known relationship between scene luminance and pixel value. Cameras are almost never linear out of the box; they apply a tone curve.
The OECF grayscale patches on the Enhanced chart let you measure the camera’s opto-electronic conversion function and invert it from the same capture, so the SFR algorithm runs on linearised data. Without them, you either skip linearisation (and accept an SFR that’s biased by the camera’s tone curve) or you shoot a separate OECF target under identical conditions (extra setup, extra error). For any SFR number you intend to publish or compare across cameras, the Enhanced chart’s in-frame OECF patches are the difference between “roughly right” and “defensible.”
This single feature is why serious imaging labs default to the Enhanced chart even when they don’t care about color.
- You need color accuracy, not just sharpness
If your scope includes color reproduction — ISP tuning, white-balance validation, camera-to-camera color matching, or any spec that mentions ΔE — the Enhanced chart’s color patches give you a Colorchecker-style reference in the same frame as your resolution test. The Standard chart is monochrome; it has nothing to say about color.
- You need texture, aliasing, or astigmatism data
The sine-wave star on the Enhanced chart enables sine-based SFR (s-SFR), which is the right tool for measuring texture loss from noise reduction, revealing direction-dependent blur (astigmatism), and characterising aliasing. Edge-based SFR alone can be fooled by scene-adaptive ISPs that sharpen edges while smearing texture — the star catches what the edge misses. If you’re evaluating modern smartphone-class cameras with aggressive computational pipelines, you need both.
What about the Extended (16:9) chart?
The Extended chart is the Enhanced chart laid out for a 16:9 native frame instead of 3:2. The patterns reach into the corners of a 16:9 sensor, so you get true corner SFR on cinema, broadcast and HDTV cameras without the test features falling outside the active image area.
You need Extended if your camera is natively 16:9 — 4K/6K/8K cinema, broadcast, automotive and many machine-vision sensors. If you test 16:9 cameras against a 3:2 chart, the chart’s corner features land in your sensor’s unused margins, and you lose exactly the corner data you were trying to measure. For 3:2 stills cameras, Extended buys you nothing; stick with Enhanced.
The asymmetric cost of buying the wrong version
This is the part that should actually drive the decision, and it’s why we lead with honesty rather than upselling.
If you over-buy (Enhanced when Standard would do): you spent some extra money. The chart still does everything Standard does. No project disruption, no wrong data, no wasted time. Worst case, you have headroom you didn’t use.
If you under-buy (Standard when you needed Enhanced): you discover the limit mid-project, usually at the worst time — when a customer asks for corner MTF, or an auditor asks how you linearised, or your color spec suddenly matters. Now you:
- order a second chart (you’ve now spent more than if you’d bought Enhanced once),
- wait for it to ship and re-validate your setup,
- re-run measurements you thought were done,
- and explain the delay to whoever’s waiting on the data.
The two outcomes are not symmetric. Over-buying costs you a fixed, small amount up front. Under-buying costs you a larger amount plus time plus credibility, at an unpredictable moment. When you’re genuinely unsure which camp you’re in, that asymmetry is the tiebreaker — lean Enhanced.
The 5-question decision check
Run these in order. Any single “yes” means you need Enhanced (or Extended). All “no” means Standard is the right, money-saving choice.
- Do you need SFR/MTF at the image corners or edges (not just center)? → Enhanced
- Do you need a linearised SFR, or to measure the camera’s tonal/OECF response? → Enhanced
- Does your scope include color accuracy (ΔE, white balance, color matching)? → Enhanced
- Do you need texture, aliasing, or astigmatism data (s-SFR / sine star)? → Enhanced
- Is your camera natively 16:9 (cinema, broadcast, automotive)? → Extended
If all five are “no” and you’re doing center-resolution QC, visual checks, or relative lens comparison, buy Standard with confidence — you’re not missing anything you’d actually use.
A simpler heuristic if you want one: monitoring a known camera → Standard. Characterising an unknown camera or lens → Enhanced. QC monitors; R&D characterises.
Frequently asked questions
Do I need the Enhanced ISO 12233 chart, or is Standard enough?
Standard is enough for center-resolution QC, visual/limiting resolution checks, and relative lens comparison. You need Enhanced if you require SFR at the image corners, a linearised SFR via OECF patches, color accuracy, or texture/aliasing data from the sine star. As a rule: monitoring a known camera needs Standard; characterising an unknown lens or camera needs Enhanced.
What does the Enhanced (Pro) ISO 12233 chart add over Standard?
Four things: six slanted squares near the image boundaries (for corner/edge SFR), OECF grayscale patches (for tonal response and SFR linearisation), color patches (for color accuracy), and a sine-wave star (for s-SFR, texture loss, astigmatism and aliasing). Everything else — wedges, center edges, fiducials — is shared with the Standard chart.
Why do OECF patches matter for an SFR measurement?
The slanted-edge SFR algorithm assumes linearised image data, but cameras apply a tone curve that makes their output non-linear. OECF patches let you measure and invert that curve from the same capture, so the SFR runs on linearised data. Without them, your SFR is biased by the camera’s tone curve — fine for rough checks, not for published or cross-camera comparisons.
What’s the difference between the Enhanced and Extended ISO 12233 chart?
The Enhanced chart is laid out for a 3:2 frame; the Extended chart places the same features for a 16:9 frame so they reach into the corners of a 16:9 sensor. Choose Extended for natively 16:9 cameras (cinema, broadcast, automotive); choose Enhanced for 3:2 stills cameras. The feature set is otherwise the same.
Is the Pro version of the ISO 12233 chart worth it?
It’s worth it if you need any of corner SFR, linearised measurement, color, or texture data — in which case the Standard chart simply can’t do the job. It’s not worth it for pure center-resolution QC or visual checks. The deciding factor is the asymmetric cost: over-buying wastes a little money, under-buying costs a re-order plus lost project time, so lean Pro when genuinely unsure.
Can I upgrade from Standard to Enhanced later?
You’d buy a new chart — the features are etched/printed into the substrate, so a Standard chart can’t be upgraded. That’s exactly why the buy-decision matters: if there’s a real chance your scope will expand to corners, color or linearisation within the chart’s 3–5 year life, buying Enhanced once is cheaper than buying Standard then Enhanced.
Does the version choice affect feature accuracy?
No. Standard, Enhanced and Extended are all available on the same substrates at the same feature accuracy (±15 µm on transmissive film, ±0.1 mm on photographic paper). The version determines which patterns are on the chart, not how accurately they’re made. Substrate determines accuracy; version determines capability.
Pick the version that matches your work — not your budget anxiety.
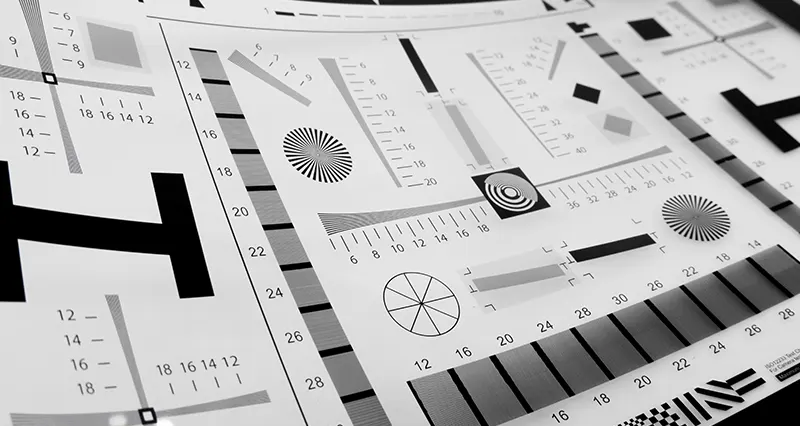
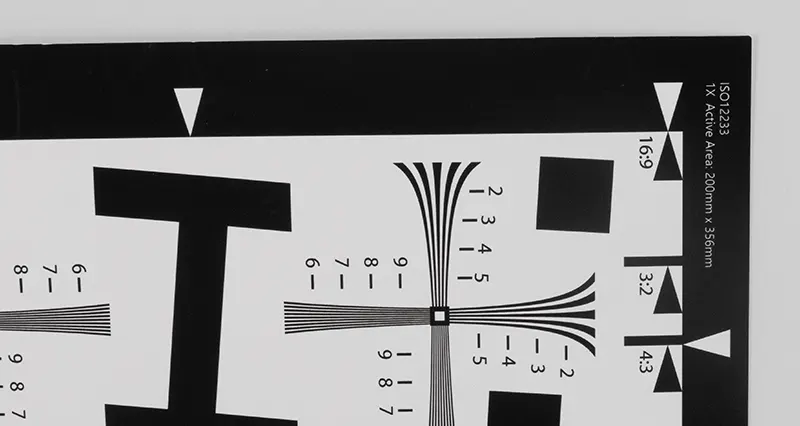
Calibvision ISO 12233 charts are available in Standard and Enhanced (Pro) versions, on transmissive film (±15 µm) and photographic paper (±0.1 mm), in 17 sizes from 50×89 mm to 1600×2844 mm. Each ships with a serial-numbered inspection report; third-party CNAS-accredited calibration is available on request. Not sure which version fits? Tell us what you’re measuring and we’ll tell you honestly whether you need Pro.
→ Compare Standard and Enhanced versions on the product page
For the full picture on how these charts work, read the Complete Guide to ISO 12233 Test Charts. To make sure your setup isn’t the thing limiting your results, read 6 Common Mistakes That Ruin Your ISO 12233 Test Results.