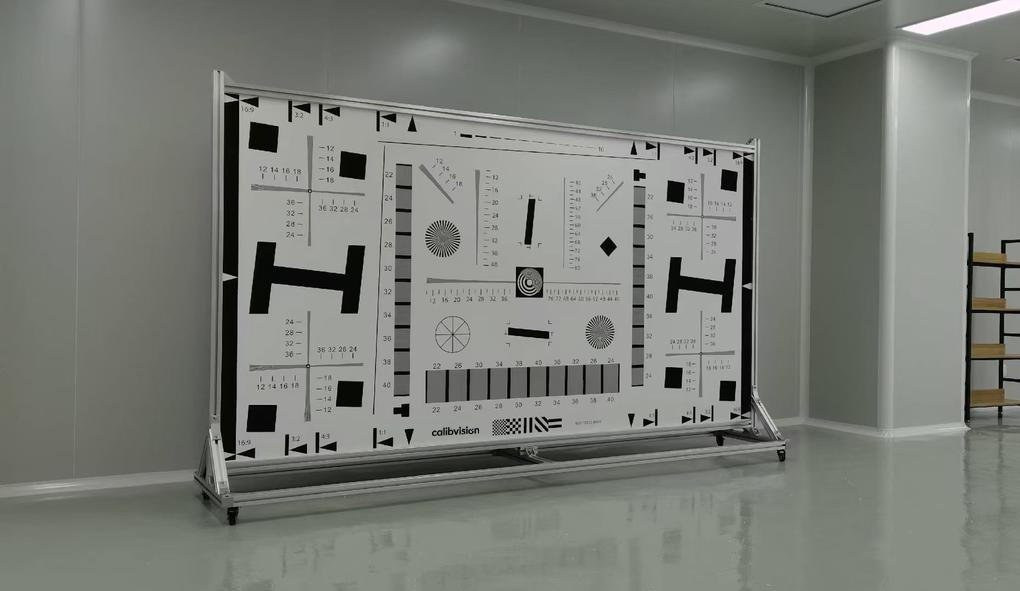
You bought the right chart. The lighting looks fine. The image is sharp. The software runs. The SFR number comes out — and it’s wrong by 20%.
If that has happened to you, you’re in good company. About nine in ten “weird SFR” tickets we see do not turn out to be the chart or the algorithm. They turn out to be one of six setup mistakes — small, easy to miss, and almost guaranteed to produce plausible-looking numbers that quietly fail an audit later.
This post is the troubleshooting companion to our Complete Guide to ISO 12233 Test Charts. Where the pillar post covers what the standard does and our printed-chart post covers the case where the chart itself is the problem, this one assumes your chart is good and walks through the six setup mistakes that ruin measurements anyway. For each one: how it fails, how to spot it, and how to fix it.
Why is my ISO 12233 SFR result wrong?
The most common cause of a bad ISO 12233 result is not the chart, the camera, or the algorithm — it’s the setup. Six issues account for the majority of failures: chart not perfectly flat, uneven or specular lighting, focus on the wrong plane, in-camera processing left on, a chart too small for the sensor, and using JPEG instead of RAW. Each can shift your SFR curve by 10–30% on its own.
That paragraph is the executive summary. The rest of the post is the how and the fix.
Mistake #1: The chart isn’t perfectly flat
A 2 mm bow at the center of an A3-sized chart sounds trivial. It will shift your MTF50 by 5–15% and there is no warning that it happened — the SFR curve looks completely normal.
Why it ruins your measurement
A non-flat chart breaks the slanted-edge algorithm in two ways simultaneously. First, parts of the chart are physically closer to or further from the lens than the focus plane, so different regions of the edge are out of focus by different amounts — the algorithm interprets that as camera blur. Second, the slanted edge is no longer at the angle the math assumes, which biases the sub-pixel reconstruction.
Professional film and paper charts have ±15 µm to ±100 µm feature accuracy as manufactured, but they only stay flat if you mount them on a rigid surface. A laminated chart taped to drywall does not.
How to diagnose it
- Shine a torch across the surface of the chart at a glancing angle and look for highlights / shadows that betray any curvature.
- Capture two slanted edges on opposite sides of the chart. If their SFR50 differs by more than ~3%, suspect chart curvature before suspecting field-edge lens fall-off.
- For film charts: confirm the light box’s front diffuser is flat (an underrated source of error).
- For paper charts: check the corners — paper that wasn’t mounted with adequate tension will lift at the corners first.
How to fix it
- Mount paper charts on a rigid aluminum-composite (ACM) or honeycomb panel with vacuum or full-area adhesive. Frames that only grip the edges will let the centre bow.
- Mount film charts on a light box with a glass (not acrylic) front diffuser; acrylic creeps over time.
- Store charts flat, between rigid sheets, never rolled. A chart that has spent a week in a tube will not lie completely flat for days.
- Re-flatten between sessions — a chart that was flat at 6 am in a cold lab may have warped by 2 pm after the HVAC has cycled.
Background: §7 of the Complete Guide — Film vs Photographic Paper →
Mistake #2: The lighting is uneven, wrong-temperature, or has glare
A 10% brightness drop from one side of the chart to the other will not look wrong to the human eye. It will absolutely show up in your SFR result, because the OECF linearisation step uses chart-side grey patches whose true reflectance is now ambiguous.
Why it ruins your measurement
ISO 12233 measurements depend on a known and uniform relationship between scene luminance and image code values. Three lighting failure modes break that:
- Uneven illumination across the chart. OECF patches at the centre report a different code value than identical patches at the edge, so the linearisation curve is wrong, and every SFR derived from linearised data is wrong with it.
- Wrong colour temperature or non-standard spectrum. The chart’s grey patches are spectrally neutral; the camera’s response to them is not. If you light a chart designed for D65 with a tungsten lamp or a cheap LED with spiky spectrum, the camera’s white-balance and tone curve do unpredictable things to the OECF data.
- Specular reflections (glare). A glossy paper or film chart lit at the wrong angle reflects the light source back into the lens. The bright patch washes out the slanted edge and your SFR result is silently corrupted.
How to diagnose it
- Photograph a uniform grey patch (or the chart’s central grey area) and measure code-value uniformity in your analysis software. Aim for better than ±5% across the chart area; treat ±10% as a hard alarm.
- Check the spectral source. Quality LED light boxes specify CRI / TLCI or full spectral data; cheap LEDs and fluorescent tubes do not.
- Look at the captured image at low exposure to see if any region clips before the rest — that’s a glare patch.
How to fix it
- For film charts: use a calibrated D65 backlight with a known luminance uniformity spec (typically ±3% or better). The light box’s internal diffuser is doing the heavy lifting; if it discolours or fogs over time, replace it.
- For paper charts: light at 45° from both sides, with the camera on the surface normal. Two lights, not one. Diffused, not directional.
- Mask everything outside the chart — reflective surroundings (white walls, the operator’s white shirt) bounce light back onto the chart and reduce effective contrast.
- Never light a glossy surface from the front-axis — that geometry guarantees a specular hit straight into the lens.
Mistake #3: Focus is on the wrong plane (and autofocus made it worse)
The eSFR slanted edge is deliberately low-contrast — that’s so the camera doesn’t clip it. Low contrast is also what autofocus systems hate most. They hunt, settle on the wrong feature, or quietly defocus by a few millimetres on the chart plane.
Why it ruins your measurement
Any defocus directly inflates the measured SFR. There is no way for the algorithm to distinguish defocus from lens blur — they look identical in the line spread function — so a half-millimetre focus error reads as a lens performance problem.
Worse, autofocus error is often non-uniform across the chart. The AF system locks on whichever feature was easiest, and the rest of the chart inherits whatever defocus comes from that lock point and lens curvature. You end up with a “soft corners” finding that is purely a focus artifact.
How to diagnose it
- Repeat the same capture three times in a row with the camera untouched. SFR50 should agree within ~1%. If it doesn’t, focus is unstable between captures.
- Compare SFR at four symmetric positions across the chart. If two opposite positions disagree by more than ~3%, suspect focus plane / chart flatness before suspecting the lens.
- Look at the central focus target (“C” on most charts). The C target should be visually crisp at native resolution. If you have to squint, the camera didn’t focus there.
How to fix it
- Manual focus, always. With magnified live view if your camera supports it.
- Focus on the central focus target specifically — not the slanted edges (low contrast, AF will hunt) and not the wedges (the wedges are supposed to blur, the AF system doesn’t know that).
- Use a small enough aperture that depth of field comfortably covers any residual chart-flatness error, but not so small that diffraction starts dominating the result. For most lab work, f/5.6–f/8 is a safe range.
- If you must use autofocus (e.g. testing the AF system itself), force it to lock on a specific high-contrast region of the chart — most modern chart designs include a dedicated AF target for exactly this.
Mistake #4: In-camera processing is still on
If sharpening, noise reduction, HDR, or any “look” profile is enabled, you are not measuring the camera. You are measuring the camera plus its image processing pipeline. Those are different measurements, and ISO 12233 specifies the former.
Why it ruins your measurement
In-camera sharpening artificially lifts the SFR curve in a way that depends on the scene — it boosts edges most where edges are strongest. The result is a curve that can show MTF > 100% at mid-frequencies, which is mathematically impossible for a real optical system and a dead giveaway that processing is interfering.
Noise reduction does the opposite, dragging the SFR curve down at the high-frequency tail. HDR composites multiple exposures and remaps tone curves, breaking the OECF assumption entirely. Picture profiles (“Vivid”, “Cinema”, “Portrait”) apply their own contrast curves and selective sharpening.
For an apples-to-apples comparison across cameras, brands or test sessions, all of this has to be off.
How to diagnose it
- An SFR curve that rises above 1.0 (i.e. above 100%) anywhere is a sharpening artifact. There is no other physically plausible cause.
- A curve that drops off too steeply at the high-frequency end (relative to a reference camera with the same sensor pitch) suggests aggressive noise reduction.
- Two cameras with the same sensor giving different SFR results almost certainly differ in their ISP setting, not their optics.
How to fix it
- Shoot RAW whenever the camera supports it. RAW captures sensor data before most of the processing pipeline runs (some sensor-level NR may still occur, but you have removed the bulk of the variability).
- Set picture profile to the neutral / flat option. Set sharpening, contrast, saturation and noise reduction sliders to 0 or “off” — not to “low”.
- Disable HDR, Active D-Lighting, ALO, dynamic range optimization, lens corrections, and chromatic aberration correction in-camera. Apply all of these afterwards in software if you need them for a different test, with the raw result kept as ground truth.
- Lock white balance to the light source colour temperature manually. Auto-WB will drift between captures and corrupts cross-session repeatability.
Mistake #5: The chart is too small (or you stood too far back)
If your slanted-edge region of interest is fewer than ~40 pixels wide on the captured image, your SFR result is on shaky ground regardless of how perfect the rest of the setup is. The algorithm runs out of data.
Why it ruins your measurement
The slanted-edge algorithm works by oversampling the edge across many image rows — typical implementations use a 5° tilt to gather sub-pixel position information across several pixel rows of the same nominal edge. If the edge region is too small, the oversampling collapses, the line-spread function gets noisy, and the SFR curve picks up that noise as if it were camera behaviour.
ISO 12233 best practice — and the rule every chart specification ultimately encodes — is that the chart should fill at least 80% of the camera frame at the working distance, with all four corner fiducials in-frame.
How to diagnose it
- Open the captured image in your SFR tool and check the width of the slanted-edge ROI in pixels. Imatest and MTF Mapper both report this. If it’s below 40 px, your chart is too small or you’re too far away.
- If you see good agreement at low spatial frequencies but the curve gets ratty above mid-frequency, edge ROI undersampling is one of the top three causes.
- For multi-region SFR mapping: if the edge ROIs at the corners are noticeably smaller than at the centre, lens distortion is shrinking the off-axis features — and you may need a larger chart.
How to fix it
- Use a larger chart. Our chart-size selector in §8 of the Complete Guide maps camera megapixels to recommended chart magnification.
- Move the camera closer until the chart fills ~80% of the frame, and the chart corners (fiducials) are still in-frame.
- For very high-resolution cameras (50 MP+) and wide-angle lenses, you may need a 2X–4X chart even at typical lab working distances. Don’t compromise — going down a chart size to keep working distance constant introduces 5–15% measurement error.
Background: §8 of the Complete Guide — Choosing Your Chart Size →
Mistake #6: Reading the result without sanity-checking it
The first thing to do with an SFR result is doubt it. The second thing to do is check three numbers — the same three numbers, every time — that catch most setup errors before they become published data.
Why it matters
ISO 12233 software will compute a curve from any image you give it, including capture-defective ones. There is no “your setup was wrong” alert. The diagnostic discipline has to come from the operator.
The three-number sanity check
For every capture, before trusting the SFR:
- MTF50 stability across three repeat captures. Should agree within ~1%. If not, focus or chart flatness is unstable.
- MTF50 symmetry left vs right (or top vs bottom). Should agree within ~3% for any lens that isn’t deliberately asymmetric. Larger differences point to chart tilt, uneven lighting, or focus on a tilted plane.
- Any SFR value > 1.0 anywhere on the curve. Should never happen. If it does, in-camera sharpening is still on.
Running these three checks adds about 90 seconds per measurement and catches the bulk of bad data before it leaves the test bench. Skip them and you ship the data, and find out it was wrong from the customer.
Quick diagnostic checklist (the one to pin above the test bench)
When an SFR result looks off, work down this list in order. The faults at the top happen ten times more often than the ones at the bottom.
- Chart flat? Glance across the surface at a low angle. No bow visible.
- Lighting even? Centre vs corner brightness within ±5%. No specular highlight on the chart surface.
- Focus on the chart plane? Central focus target sharp at 100% pixel view. Manual focus, not auto.
- In-camera processing off? Sharpening 0, NR 0, HDR off, picture profile neutral, RAW capture.
- Chart fills 80%+ of frame? All four fiducials visible. Slanted-edge ROI ≥ 40 px wide.
- Three sanity checks pass? Repeat-capture stability < 1%, left/right symmetry < 3%, no SFR > 1.0.
Six checks. Sixty seconds. They will save you a half-day re-test about once a week.
Frequently asked questions
Why does my ISO 12233 SFR curve go above 1.0?
An SFR value greater than 1.0 (100% modulation) is physically impossible for an unprocessed optical signal. It means in-camera sharpening, ISP edge enhancement, or a similar processing step is still active and artificially boosting mid-frequency response. Re-capture in RAW with all picture profiles set to neutral and sharpening at 0.
Do I need to shoot RAW for ISO 12233 measurements?
Yes, for any measurement you intend to publish or audit. RAW preserves the camera’s linear response before in-camera sharpening, noise reduction, tone mapping and lens correction run. JPEG applies all of those, scene-dependently, and corrupts the SFR result by amounts that vary between captures.
Should I use autofocus on a slanted-edge chart?
No. The slanted edge on a modern eSFR chart is deliberately low-contrast (4:1), which is the worst case for camera autofocus. AF systems hunt, lock on the wrong feature, or settle a few millimetres off the chart plane — and any defocus inflates the SFR result. Use manual focus on the central focus target, with magnified live view.
How even does the lighting need to be?
Aim for luminance uniformity within ±5% across the chart area; treat anything worse than ±10% as failed. Light film charts with a calibrated D65 backlight and verify the diffuser is uniform. Light paper charts at 45° from both sides with diffused D65 sources, with the camera on the surface normal.
Why does my ISO 12233 chart need to be perfectly flat?
A non-flat chart introduces simultaneous defocus and perspective error — the slanted-edge algorithm reads both as camera blur. A 2 mm bow at the centre of an A3 chart can shift MTF50 by 5–15%. Mount paper charts on rigid ACM or honeycomb panels with full-area adhesive; never trust a frame that grips only the edges.
What chart size do I need for my camera?
The chart should fill at least 80% of the camera frame at the working distance, with all four corner fiducials in-frame and the slanted-edge ROI at least 40 pixels wide on the captured image. For a 24 MP camera at typical lab distances, a 1X chart (200×356 mm) is the usual starting point; high-megapixel and wide-angle setups need 2X–4X.
How can I tell if it’s a setup problem or a real lens issue?
Repeat-capture three times: if MTF50 doesn’t agree within 1%, your setup is unstable (focus, chart flatness, or lighting drift). Compare symmetric positions: if left and right edges disagree by more than 3% on a symmetric lens, the chart is tilted or the lighting is uneven. Real lens issues are stable and follow the lens’s known fall-off pattern.
Stop chasing setup errors. Start measuring the lens.
Calibvision ISO 12233 resolution & SFR test charts are laser-drawn on transmissive film at ±15 µm feature accuracy or printed on matte photographic paper at ±0.1 mm — in 17 sizes from 50×89 mm up to 1600×2844 mm, Standard and Enhanced (Pro) versions. Each chart ships with a serial-numbered inspection report; third-party CNAS-accredited (CNAS L0579) calibration is available on request.
→ See the ISO 12233 chart range and pick your size
For the broader picture on ISO 12233 testing, read the Complete Guide to ISO 12233 Test Charts. For why the chart itself is often the silent culprit, read Why a $50 Printed ISO 12233 Chart Is Lying About Your Lens Sharpness.