Camera calibration targets and test charts do two different jobs. Geometric targets — checkerboard, ChArUco, dot grid and AprilGrid — carry precisely placed features that let software solve a camera’s distortion, intrinsics and pose. Resolution and imaging charts — USAF 1951, ISO 12233 and ISO 15739 — measure sharpness, noise and tone response. Choose by task, software and accuracy budget.
The two families are not interchangeable. A geometric target teaches the software what the camera is doing to straight lines and known distances; a resolution chart reports how well the finished image holds detail and tone. Most measurement systems end up using one of each. The table below is the short answer, and the sections that follow give the reasoning behind each choice.
At a glance — which target, when
| # | Target / chart | Family | Best for | Software | Shop |
|---|---|---|---|---|---|
| 1 | Checkerboard | Geometric | Single 2D camera, full board in view, densest corner set | OpenCV, MATLAB | Checkerboard → |
| 2 | ChArUco | Geometric | Partial view, wide FOV, multi-camera, occlusion | OpenCV, MATLAB | ChArUco → |
| 3 | Dot grid (circle grid) | Geometric | Distortion mapping, centroid robustness, HALCON | HALCON, OpenCV | Dot grid → |
| 4 | AprilGrid | Geometric | Camera–IMU, multi-sensor rigs, VIO/SLAM | Kalibr (ROS) | AprilGrid → |
| 5 | USAF 1951 | Resolution | Visual limiting resolution, microscopy, lens QC | Visual / Imatest Stepchart | USAF 1951 → |
| 6 | ISO 12233 (e-SFR) | Resolution | MTF / sharpness, automated camera QC | Imatest, iQ-Analyzer | ISO 12233 → |
| 7 | ISO 15739 | Imaging | Noise, SNR, dynamic range, OECF | Imatest, iQ-Analyzer | ISO 15739 → |
Group A — Geometric calibration targets
Geometric targets solve the camera model: focal length, principal point, lens distortion coefficients, and, with a known board, pose. What separates them is how the software locates the features and how it behaves when the board is only partly in frame.
1. Checkerboard — the default, when the whole board is in view
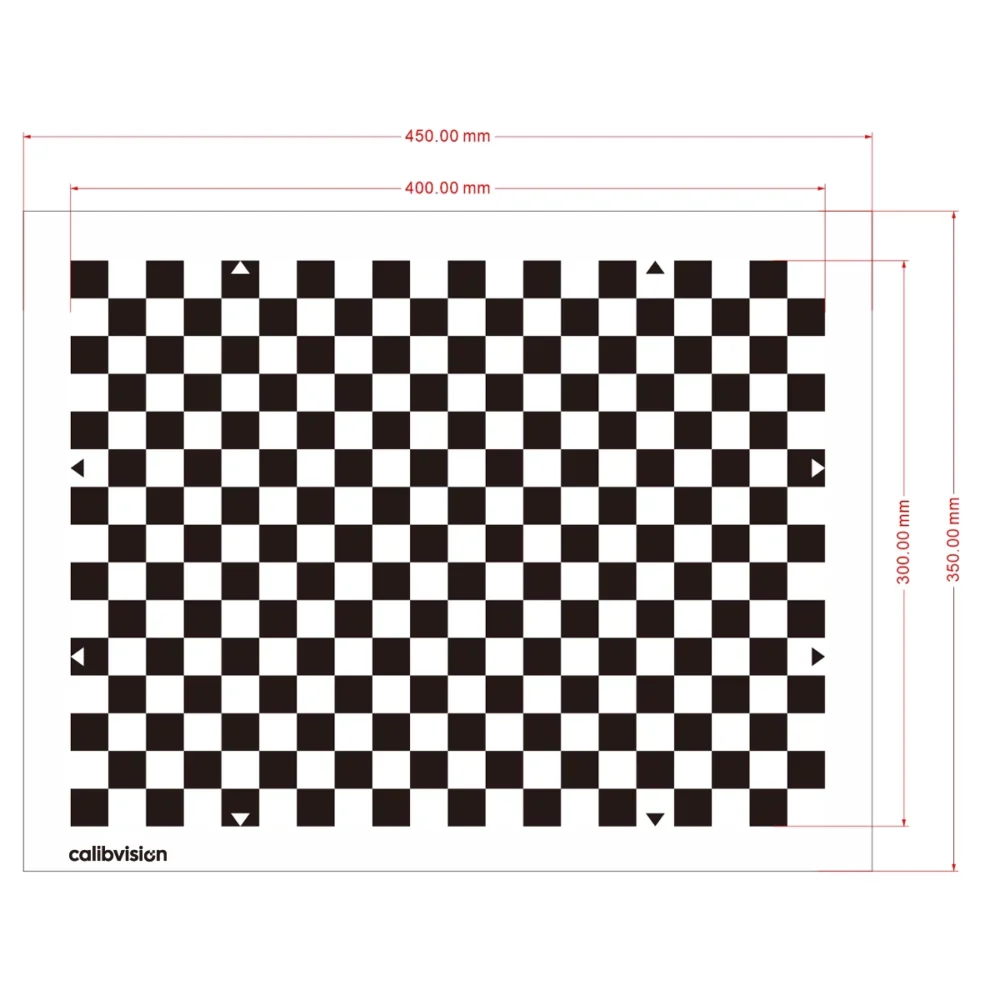
A checkerboard target is a grid of alternating black and white squares used to calibrate a single camera. The algorithm locates the saddle points where four squares meet; because a saddle is bounded by pixels on all sides, it refines to sub-pixel position reliably, which makes the checkerboard the densest and simplest geometric target for a controlled setup.
Its limitation is detection behaviour. Most detectors accept a view only when the whole board is visible, so an occluded corner or a board running off the frame edge causes the view to be rejected. For rotation invariance, one dimension is made even and the other odd so the board cannot be matched to a 180-degree flip. On glass, the pattern is a laser-written photolithographic chrome layer, which holds sharp, high-contrast edges without ink bleed.
| Detected feature | Saddle-point corners (sub-pixel) |
| Solves | Intrinsics, lens distortion, pose (single camera) |
| Software | OpenCV, MATLAB |
| Substrate & accuracy | Soda-lime ±1 µm · quartz ±0.5 µm (local feature accuracy); ceramic ±2 µm; film ±15 µm |
| Best fit | Single 2D camera, XY-stage and optical-system calibration, full board in view |
Learn how corner detection works in Understanding Calibration Patterns and, for the OpenCV workflow, OpenCV Checkerboard Calibration Targets. Shop the Checkerboard Calibration Target — ChessMark™ series.
2. ChArUco — a checkerboard that still works when it’s half-hidden
A ChArUco board embeds a uniquely coded ArUco marker in each white square of a checkerboard. Because every marker identifies which corner the software is looking at, the board calibrates from a partial view — the property a plain checkerboard lacks. It keeps sub-pixel checkerboard-corner accuracy while tolerating occlusion and frame-edge cut-off.
That combination is why ChArUco has become the default for wide-angle lenses, stereo pairs and multi-camera rigs, where the board rarely sits fully inside every frame. It is native to OpenCV. For a single camera at a fixed close range, a plain checkerboard is denser and simpler; the advantage of ChArUco appears when visibility is not guaranteed.
| Detected feature | Checkerboard corners + coded ArUco markers |
| Solves | Intrinsics, distortion, pose — including from partial views |
| Software | OpenCV, MATLAB |
| Substrate & accuracy | Quartz ±0.5 µm · soda-lime ±1 µm (local feature accuracy); ceramic ±2 µm; film ±15 µm |
| Best fit | Wide FOV, multi-camera and stereo, robotics, partial-visibility calibration |
For dictionary, marker ratio and substrate selection, see How to Choose a ChArUco Board. Shop the ChArUco Calibration Board.
3. Dot grid — centroids, distortion maps and HALCON
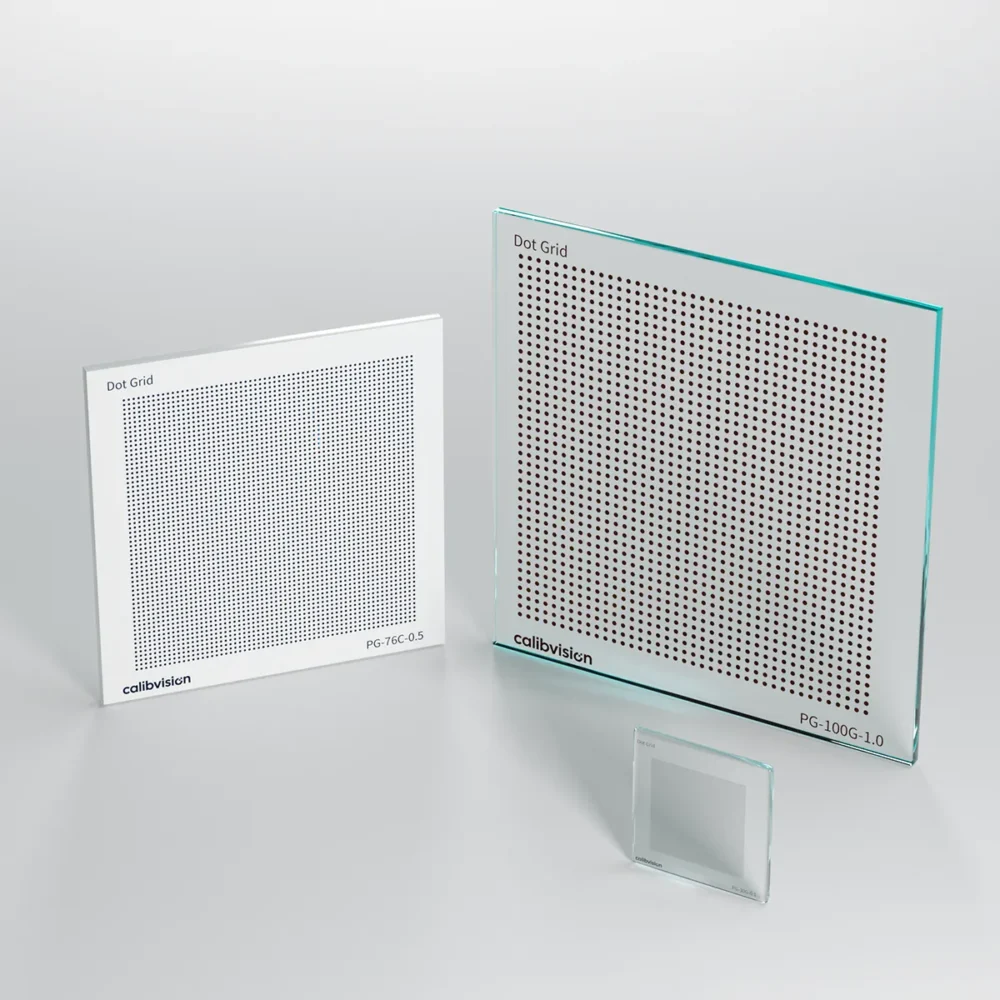
A dot grid is a regular array of circles whose centroids serve as calibration features. The software finds each centroid by averaging many edge pixels, which is stable against sensor noise and mild defocus. Grids are the standard tool for distortion mapping: in an undistorted image every row and column stays straight, so any curvature reveals the lens distortion directly. Grids may be positive or negative, symmetric or asymmetric; an asymmetric grid removes orientation ambiguity.
MVTec HALCON’s calibration plate (CALTAB) is a dot-grid pattern, so a HALCON pipeline usually calls for this target. One physical effect is worth noting: under strong perspective, projected circles become ellipses and the apparent centroid shifts slightly. Mature calibration software compensates for this, but it is the reason very high-tilt views are handled carefully.
| Detected feature | Circle centroids (sub-pixel) |
| Solves | Distortion mapping, intrinsics, stereo alignment |
| Software | HALCON (CALTAB), OpenCV circle-grid |
| Substrate & accuracy | Soda-lime ±1 µm · quartz ±0.5 µm (local feature accuracy); ceramic ±2 µm; film ±15 µm |
| Best fit | Distortion analysis, HALCON pipelines, multi-camera and stereo |
Corner-versus-centroid detection is explained in Understanding Calibration Patterns. Shop the Dot Grid Calibration Target.
4. AprilGrid — for camera–IMU and multi-sensor calibration
An AprilGrid is a spaced array of AprilTags, each carrying a unique code. Like ChArUco it tolerates partial views, but it is specifically the pattern the Kalibr toolbox expects for spatial and temporal calibration of camera–IMU and multi-camera systems. In a ROS pipeline calibrating a visual-inertial or SLAM rig, AprilGrid is the required input.
AprilGrid and ChArUco are often confused. They use different marker families (AprilTag versus ArUco) and different toolchains (Kalibr versus OpenCV); a board built for one will not be detected by the other. Selecting the grid to match the toolbox is the first decision, before size or substrate.
| Detected feature | Coded AprilTags with inter-tag spacing |
| Solves | Camera–IMU and multi-sensor spatial/temporal calibration |
| Software | Kalibr (ROS) |
| Substrate & accuracy | Glass ±0.5–1 µm (local feature accuracy); film ±15 µm for large boards |
| Best fit | VIO/SLAM, camera–IMU, multi-sensor rigs |
The tag families are compared in Understanding Calibration Patterns. Shop the AprilGrid Calibration Target. <!– [CONFIRM] swap to /product/ slug if a dedicated product page exists –>
Group B — Resolution & imaging test charts
These charts do not solve a camera model; they measure one. They report how sharp the system is, how much noise it carries, and how it maps scene brightness to pixel values.
5. USAF 1951 — the classic visual resolution test
The USAF 1951 target is a resolution chart defined by U.S. military standard MIL-STD-150A in 1951. It presents horizontal and vertical bar triplets in 9 groups of 6 elements — 54 elements — each finer than the last. The user reads the limiting resolution by finding the smallest bar group still resolved. Resolution in line pairs per millimetre follows lp/mm = 2^(group + (element − 1)/6).
It remains the most widely cited resolution standard in microscopy, objective-lens QC and optics benches, because reading limiting resolution by eye needs no software. Its scope is limited to a single limiting figure rather than a full sharpness curve; when a continuous MTF plot is required, ISO 12233 is used instead.
| Pattern | 9 groups × 6 elements bar triplets (54 elements) |
| Measures | Limiting resolution (lp/mm), read visually |
| Software | None required; Imatest Stepchart for assisted reading |
| Substrate & accuracy | Quartz / soda-lime / ceramic / film; local feature accuracy from ±0.85 µm; min line width to 0.7 µm |
| Best fit | Microscopy, lens and optical-system QC, visual resolution checks |
Groups, elements and the lp/mm formula are worked through in How to Read a USAF 1951 Chart. Shop the USAF 1951 Resolution Target. <!– [CONFIRM] /product/ slug if live –>
6. ISO 12233 — the modern MTF / slanted-edge standard
The ISO 12233 test chart is the current standard for measuring the spatial frequency response (SFR) of digital cameras. Its defining feature is the slanted edge: analysis software (Imatest, iQ-Analyzer) takes a lightly tilted black-to-white edge and computes the full MTF curve — sharpness across spatial frequency — rather than a single number. The e-SFR edition (ISO 12233:2017) tiles many slanted squares with OECF and colour patches, so one capture characterises sharpness across the frame.
A low 4:1 edge contrast is specified so the measurement is not distorted by clipping or in-camera sharpening. Editions differ (2000, 2014, 2017); the chart is matched to the edition named in the test specification. For production camera QC — phone, automotive and industrial modules — ISO 12233 is the automated, repeatable choice.
| Pattern | Slanted edges (e-SFR: tiled squares) + OECF/colour patches |
| Measures | MTF / SFR (sharpness vs frequency) |
| Software | Imatest, iQ-Analyzer |
| Edge contrast | 4:1 low contrast (ISO 12233 method) |
| Substrate | Chrome-on-glass or film (transmissive/reflective) |
| Best fit | Automated MTF/sharpness QC of digital cameras and modules |
For the underlying method, see the Complete Guide to Camera Calibration Targets. Shop the eSFR ISO 12233:2017 Test Chart; for a pure chrome-on-glass slanted-edge target, see the Chrome-on-Glass MTF Target.
7. ISO 15739 — noise, dynamic range and tone response
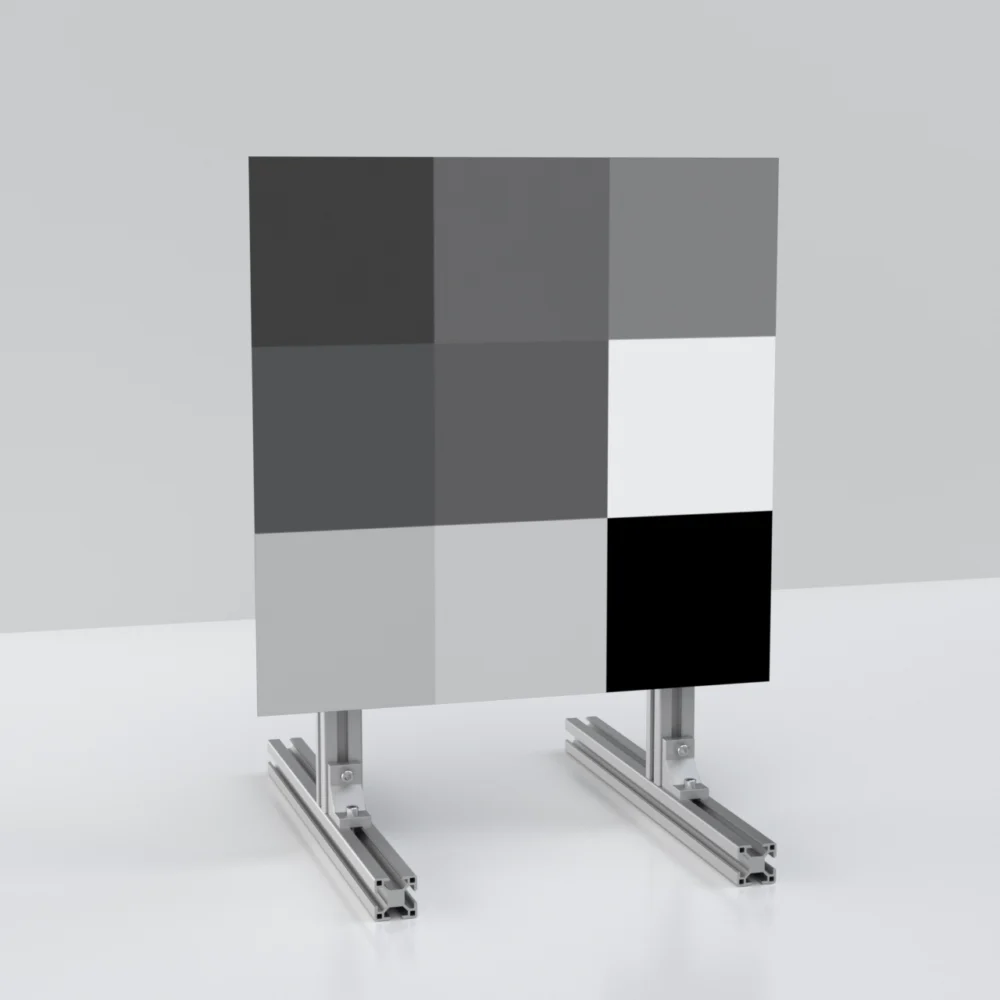
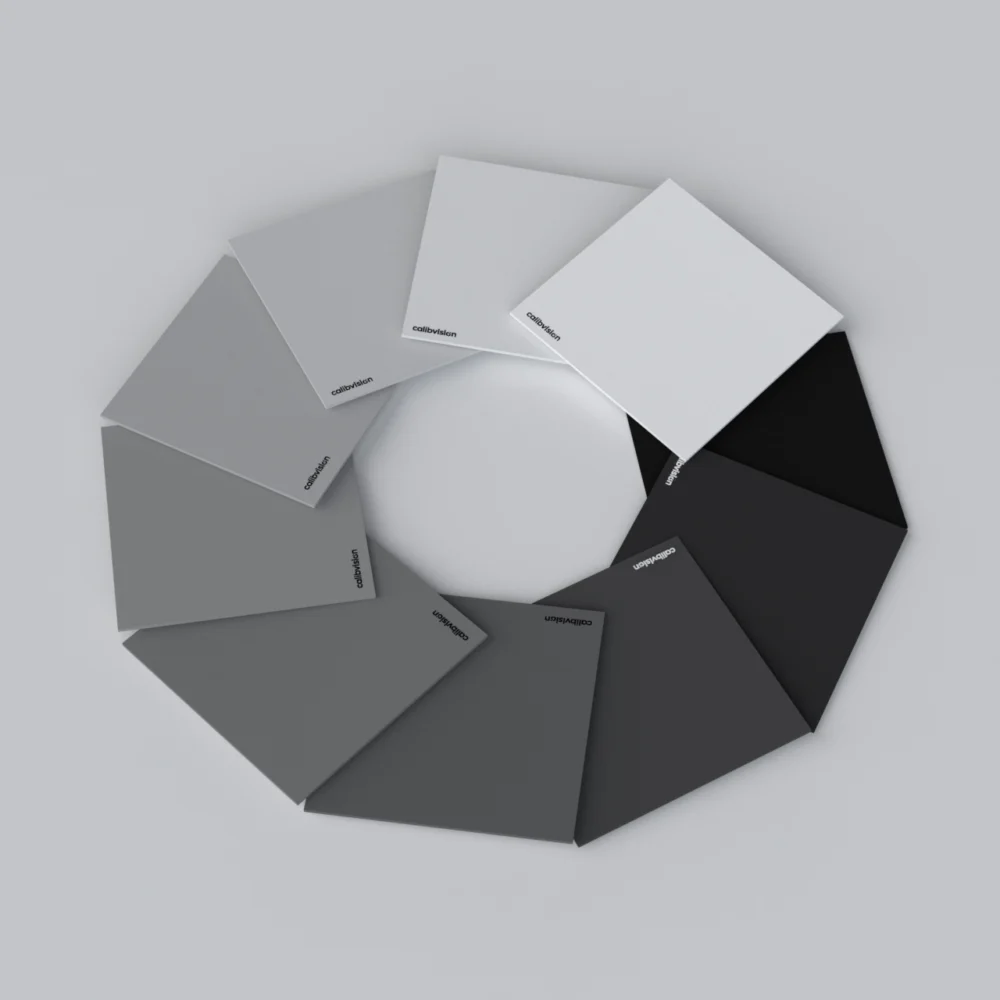
The ISO 15739 test chart measures image noise and the opto-electronic conversion function (OECF) — how a camera converts scene luminance into pixel values, its signal-to-noise ratio, and its dynamic range. It uses a set of calibrated grayscale patches spanning a wide density range, from which software fits the tone curve and quantifies noise at each level.
Where ISO 12233 covers sharpness, ISO 15739 covers the other half of image quality: noise and tone. The two are commonly run together to characterise a camera fully.
| Pattern | Calibrated grayscale / OECF patch series |
| Measures | Noise, SNR, dynamic range, tone response (OECF) |
| Software | Imatest, iQ-Analyzer |
| Substrate | Transmissive or reflective, per test setup |
| Best fit | Noise, dynamic-range and tone-response measurement |
Sharpness and noise sit on the same image-quality workflow — background in the Complete Guide to Camera Calibration Targets. Shop the ISO 15739 Test Chart.
How to choose in three questions
Three questions settle most selections.
First, geometry or image quality. To calibrate the camera model — distortion, intrinsics, measurement, pose — use a geometric target (rows 1–4). To measure how good the image is — sharpness, noise, tone — use a resolution or imaging chart (rows 5–7). Many systems need one of each.
Second, the software. OpenCV and MATLAB use checkerboards or ChArUco; HALCON uses a dot grid (CALTAB); Kalibr uses an AprilGrid; Imatest uses ISO 12233 for sharpness and ISO 15739 for noise; USAF 1951 needs no software. Matching the pattern to the toolchain is not optional — the wrong pattern is not detected at all.
Third, the accuracy budget. A calibration target should be roughly one order of magnitude more accurate than the system it calibrates. Photolithographic chrome-on-glass holds ±1 µm on soda-lime and ±0.5 µm on quartz (local feature accuracy), ±2 µm on ceramic and ±15 µm on film. A printed target carries tens to hundreds of microns of positional error and shifts with humidity, which then caps the accuracy of everything measured with it.
Targets ship with a per-unit serial-numbered inspection report; NIST/NIM-traceable third-party calibration under CNAS L0579, internationally recognised through the ILAC-MRA, is available on request. To preview a checkerboard, ChArUco, AprilGrid or circle grid to your exact dimensions, use the free calibration pattern generator, or send a camera, field of view and accuracy target for a specified board.